Skip to content

Data Science Tutorials

For Data Science Learners

  • How to choose optimal number of epochs in R
    How to choose optimal number of epochs in R Machine Learning
  • Top Data Science Examples You Should Know 2023
    Top Data Science Applications You Should Know 2023 Machine Learning
  • How to Check if a Directory Exists in R
    How to Check if a Directory Exists in R R
  • Statistical test assumptions and requirements
    Statistical test assumptions and requirements Statistics
  • Pattern Mining Analysis in R-With Examples R
  • Descriptive Statistics in R R
  • Sort or Order Rank in R R
  • How to Find Correlation Coefficient p value in R
    How to Find Correlation Coefficient p value in R R

Tag: ggrepel

How to add labels at the end of each line in ggplot2?

Posted on May 25May 25 By Admin No Comments on How to add labels at the end of each line in ggplot2?
How to add labels at the end of each line in ggplot2?

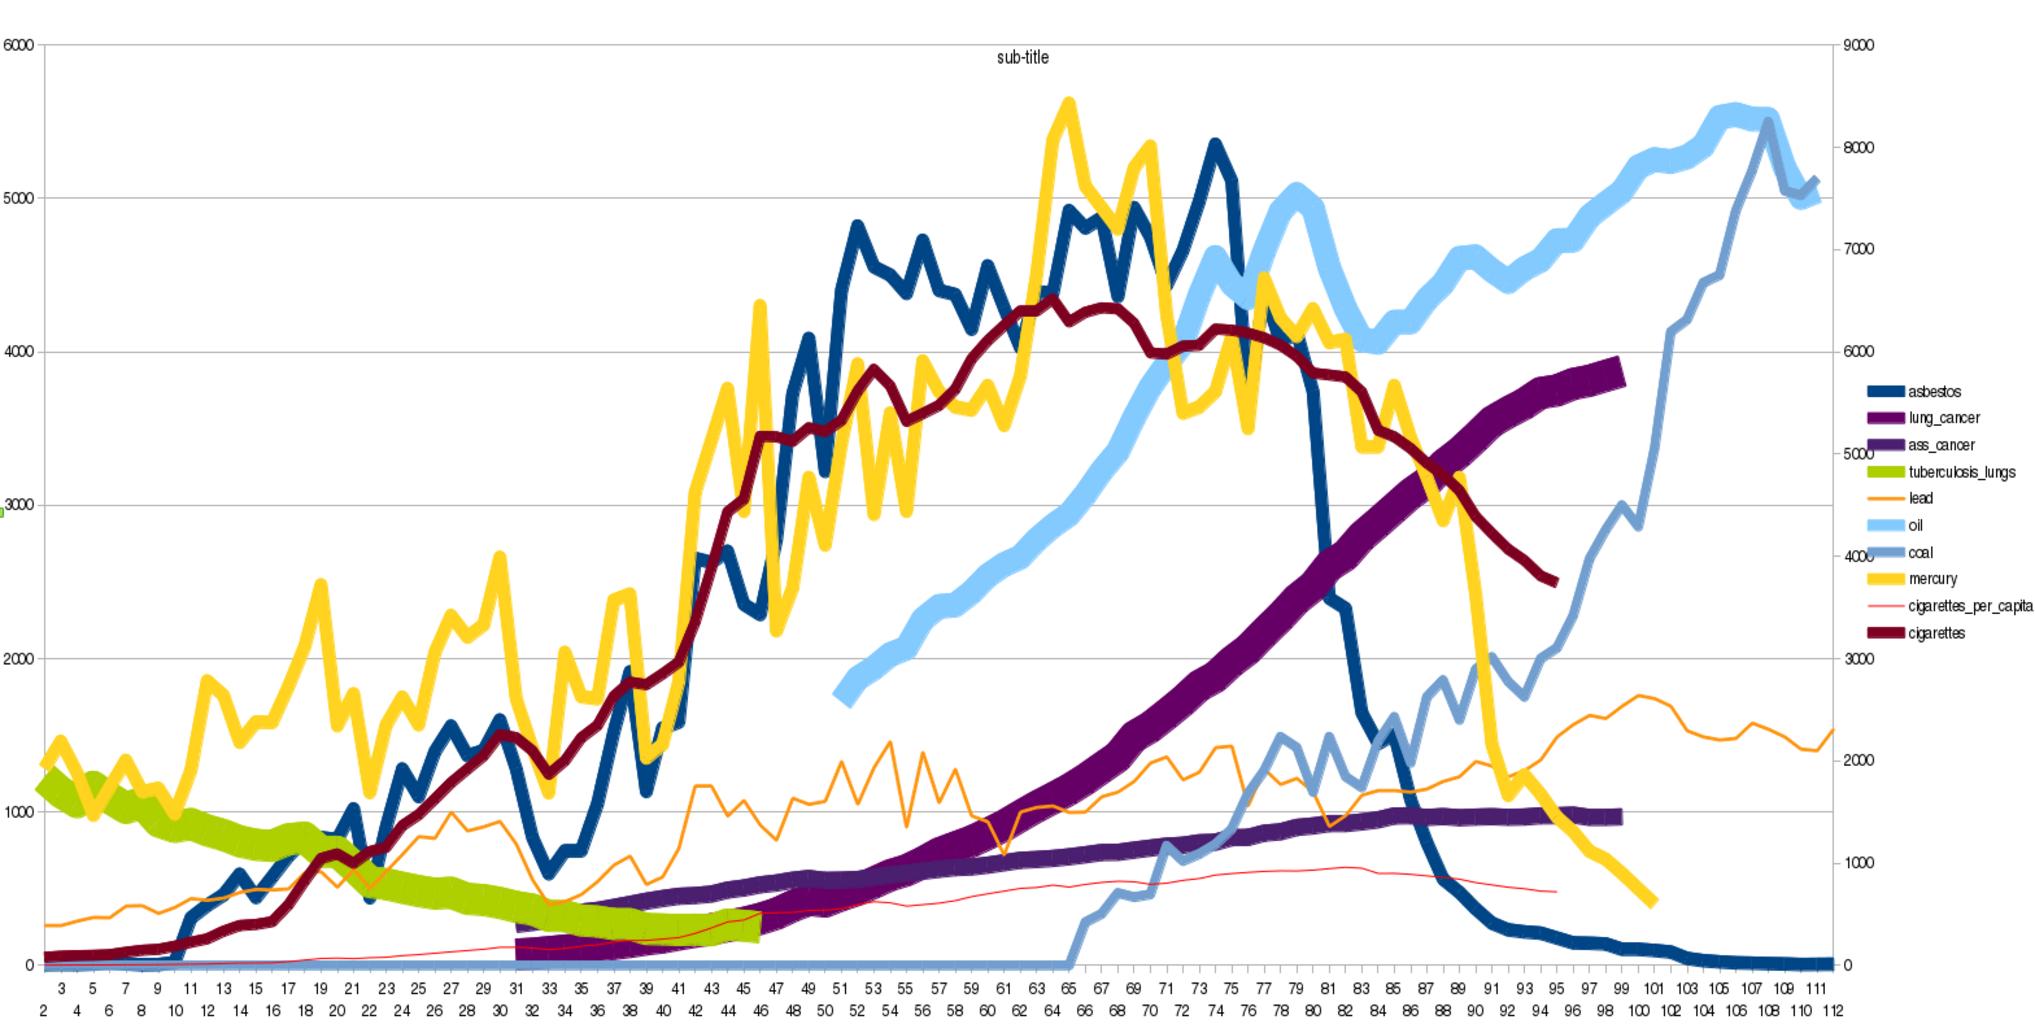
How to add labels at the end of each line in ggplot2?, Using the ggplot2 R library, this article shows how to display the last value of each line as a label. Using either the ggrepel text labeling or the ggplot2 secondary axis functions, many methods are shown. Test for Normal Distribution in R-Quick Guide…

Read More “How to add labels at the end of each line in ggplot2?” »

R
  • Best Prompt Engineering Books
  • Understanding Machine Learning and Data Science
  • Best Git Books
  • Top 5 Books to Learn Data Engineering
  • Mastering R Programming for Data Science: Tips and Tricks
  • About Us
  • Contact
  • Disclaimer
  • Privacy Policy

https://www.r-bloggers.com

  • YouTube
  • Twitter
  • Facebook
  • Course
  • Excel
  • Machine Learning
  • Opensesame
  • R
  • Statistics

Check your inbox or spam folder to confirm your subscription.

  • How to Calculate Ratios in R
    How to Calculate Ratios in R R
  • How to Analyze Likert Scale Data
    How to Analyze Likert Scale Data? Statistics
  • Determine the significance of a mediation effect in R
    Determine the significance of a mediation effect in R R
  • Type II Error in R
    Type II Error in R R
  • Remove Rows from the data frame in R
    Remove Rows from the data frame in R R
  • similarity measure between two populations
    Similarity Measure Between Two Populations-Brunner Munzel Test Statistics
  • How to Create a Frequency Table by Group in R
    How to Create a Frequency Table by Group in R? R
  • optim Function in R R

Privacy Policy

Copyright © 2025 Data Science Tutorials.

Powered by PressBook News WordPress theme