Skip to content

Data Science Tutorials

For Data Science Learners

  • How to Find Quartiles in R
    How to Find Quartiles in R? R
  • How to use image function in R
    How to use the image function in R R
  • 5 Free Books to Learn Statistics For Data Science
    5 Free Books to Learn Statistics For Data Science Course
  • gganatogram Plot in R
    How to create Anatogram plot in R R
  • Cross-validation in Machine Learning
    Cross-validation in Machine Learning Statistics
  • what-is-epoch-in-machine-learning
    What is Epoch in Machine Learning? Machine Learning
  • Anderson-Darling Test in R With Examples
    Anderson-Darling Test in R With Examples R
  • how to create a hexbins chart in R
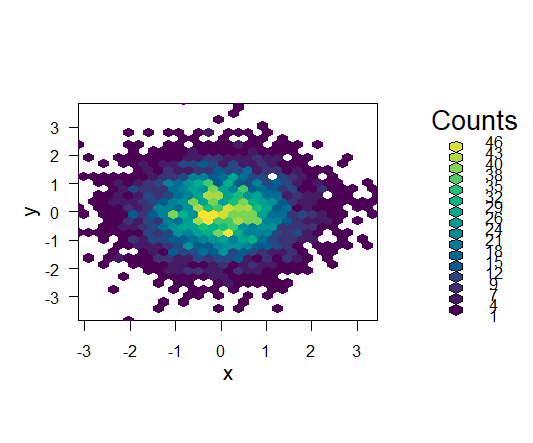
    How to create a hexbin chart in R R

Tag: heatmap

How to draw heatmap in r: Quick and Easy way

Posted on May 16May 16 By Admin No Comments on How to draw heatmap in r: Quick and Easy way
How to draw heatmap in r: Quick and Easy way

How to draw heatmap in r?, A heatmap is essentially a table with colors replacing the numbers. The colors represent the measuring level. It can help you locate highs and lows, as well as patterns. In this article, We’ll show you how to create a clustered heatmap with the R programming language’s pheatmap package. Let’s…

Read More “How to draw heatmap in r: Quick and Easy way” »

R
  • Maximizing Model Accuracy with Train-Test Splits in Machine Learning
  • Type II Errors in R
  • Best Prompt Engineering Books
  • Understanding Machine Learning and Data Science
  • Best Git Books
  • About Us
  • Contact
  • Disclaimer
  • Privacy Policy

https://www.r-bloggers.com

  • YouTube
  • Twitter
  • Facebook
  • Course
  • Excel
  • Machine Learning
  • Opensesame
  • R
  • Statistics

Check your inbox or spam folder to confirm your subscription.

  • How to Create a Covariance Matrix in R
    How to Create a Covariance Matrix in R? R
  • R Percentage by Group Calculation
    R Percentage by Group Calculation R
  • How to Display Percentages on Histogram IN R
    How to Display Percentages on Histogram in R R
  • Top Data Modeling Tools for 2023
    Top Data Modeling Tools for 2023 Machine Learning
  • How to check regression analysis heteroscedasticity in R
    How to check regression analysis heteroscedasticity in R R
  • How to put margins on tables or arrays in R?
    How to put margins on tables or arrays in R? R
  • Comparison between Statistics and Luck
    Lottery Prediction-Comparison between Statistics and Luck Machine Learning
  • In data science, what Is Open Innovation?
    In data science, what Is Open Innovation? R

Privacy Policy

Copyright © 2025 Data Science Tutorials.

Powered by PressBook News WordPress theme