Skip to content

Data Science Tutorials

For Data Science Learners

  • Fisher’s exact test in R
    Fisher’s exact test in R R
  • A Side-by-Side Boxplot in R
    A Side-by-Side Boxplot in R: How to Do It R
  • The Uniform Distribution in R
    The Uniform Distribution in R R
  • How to remove files and folders in R
    How to remove files and folders in R R
  • Predictive Modeling and Data Science
    Predictive Modeling and Data Science Machine Learning
  • How to Implement the Sklearn Predict Approach
    How to Implement the Sklearn Predict Approach? R
  • How to add Axes to Plot in R R
  • How to Scale Only Numeric Columns in R
    How to Scale Only Numeric Columns in R R
how to create a hexbins chart in R

How to create a hexbin chart in R

Posted on October 26October 26 By Admin No Comments on How to create a hexbin chart in R

How to create a hexbin chart in R, The hexbin package in base R provides a function with the same name that creates a plottable hexbin object, which can be used to make a hexbin chart.

# install.packages("hexbin")
library(hexbin)
# Data
set.seed(123)
x <- rnorm(5000)
y <- rnorm(5000)
hex <- hexbin(x, y)
plot(hex)

How to do Conditional Mutate in R? – Data Science Tutorials

Number of bins

The number of bins is controlled by the xbins option. 30 is the default value.

hex <- hexbin(x, y, xbins = 20)
plot(hex)

Best Books to learn Tensorflow – Data Science Tutorials

Border color

hex <- hexbin(x, y)
plot(hex, border = 4)
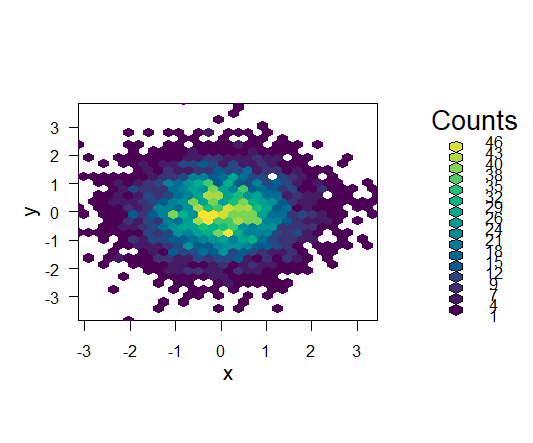
Color palette

hex <- hexbin(x, y)
plot(hex, colramp = colorRampPalette(hcl.colors(12)))

What is Ad Hoc Analysis? – Data Science Tutorials

Remove the legend

hex <- hexbin(x, y)
plot(hex, legend = FALSE,
     colramp = colorRampPalette(hcl.colors(12, "GnBu"))) 

Check your inbox or spam folder to confirm your subscription.

Convert multiple columns into a single column-tidyr Part4 (datasciencetut.com)

R

Post navigation

Previous Post: The pheatmap function in R
Next Post: How to use the image function in R

Related Posts

  • Two-Way ANOVA Example in R
    How to perform One-Sample Wilcoxon Signed Rank Test in R? R
  • Subsetting with multiple conditions in R
    Subsetting with multiple conditions in R R
  • Number to Percentage in R
    Number to Percentage in R R
  • How to Find the Size of a Data Frame in R R
  • Hypothesis Testing in R
    Hypothesis Testing in R R
  • Correlation Coefficient p value in R
    Correlation Coefficient p value in R R

Leave a Reply Cancel reply

Your email address will not be published. Required fields are marked *

  • Best Prompt Engineering Books
  • Understanding Machine Learning and Data Science
  • Best Git Books
  • Top 5 Books to Learn Data Engineering
  • Mastering R Programming for Data Science: Tips and Tricks
  • About Us
  • Contact
  • Disclaimer
  • Privacy Policy

https://www.r-bloggers.com

  • YouTube
  • Twitter
  • Facebook
  • Course
  • Excel
  • Machine Learning
  • Opensesame
  • R
  • Statistics

Check your inbox or spam folder to confirm your subscription.

  • ggpairs in R
    ggpairs in R R
  • Normal distribution in R
    Normal Distribution in R R
  • How to Use the Multinomial Distribution in R
    How to Use the Multinomial Distribution in R? R
  • How to perform kruskal wallis test in r
    How to perform the Kruskal-Wallis test in R? R
  • How do augmented analytics work
    How do augmented analytics work? R
  • Group By Minimum in R
    Group By Minimum in R R
  • Arrange Data by Month in R
    Arrange Data by Month in R with example R
  • How to create contingency tables in R
    How to create contingency tables in R? R

Privacy Policy

Copyright © 2025 Data Science Tutorials.

Powered by PressBook News WordPress theme