How to Load the Analysis ToolPak in Excel, the Analysis ToolPak is an add-in in Microsoft Excel that provides advanced data analysis tools for use in a variety of business, finance, and scientific scenarios.
Its main advantage is that it enables users to perform complex statistical and engineering analyses in Excel, without the need for extensive knowledge of advanced mathematics.
If you need to load the Analysis ToolPak in Excel, this guide will provide you with step-by-step instructions on how to do so.
Step 1: Open Excel
The first step is to open Excel on your computer. Click on the Start menu button or use the Windows search bar to find Excel and open it. Once you have opened Excel, you will see the Excel workbook.
Step 2: Go to the Options menu
In the Excel workbook, go to the menu bar and click on the “File” menu option. A drop-down menu displays several options, and from the list, click on “Options”.
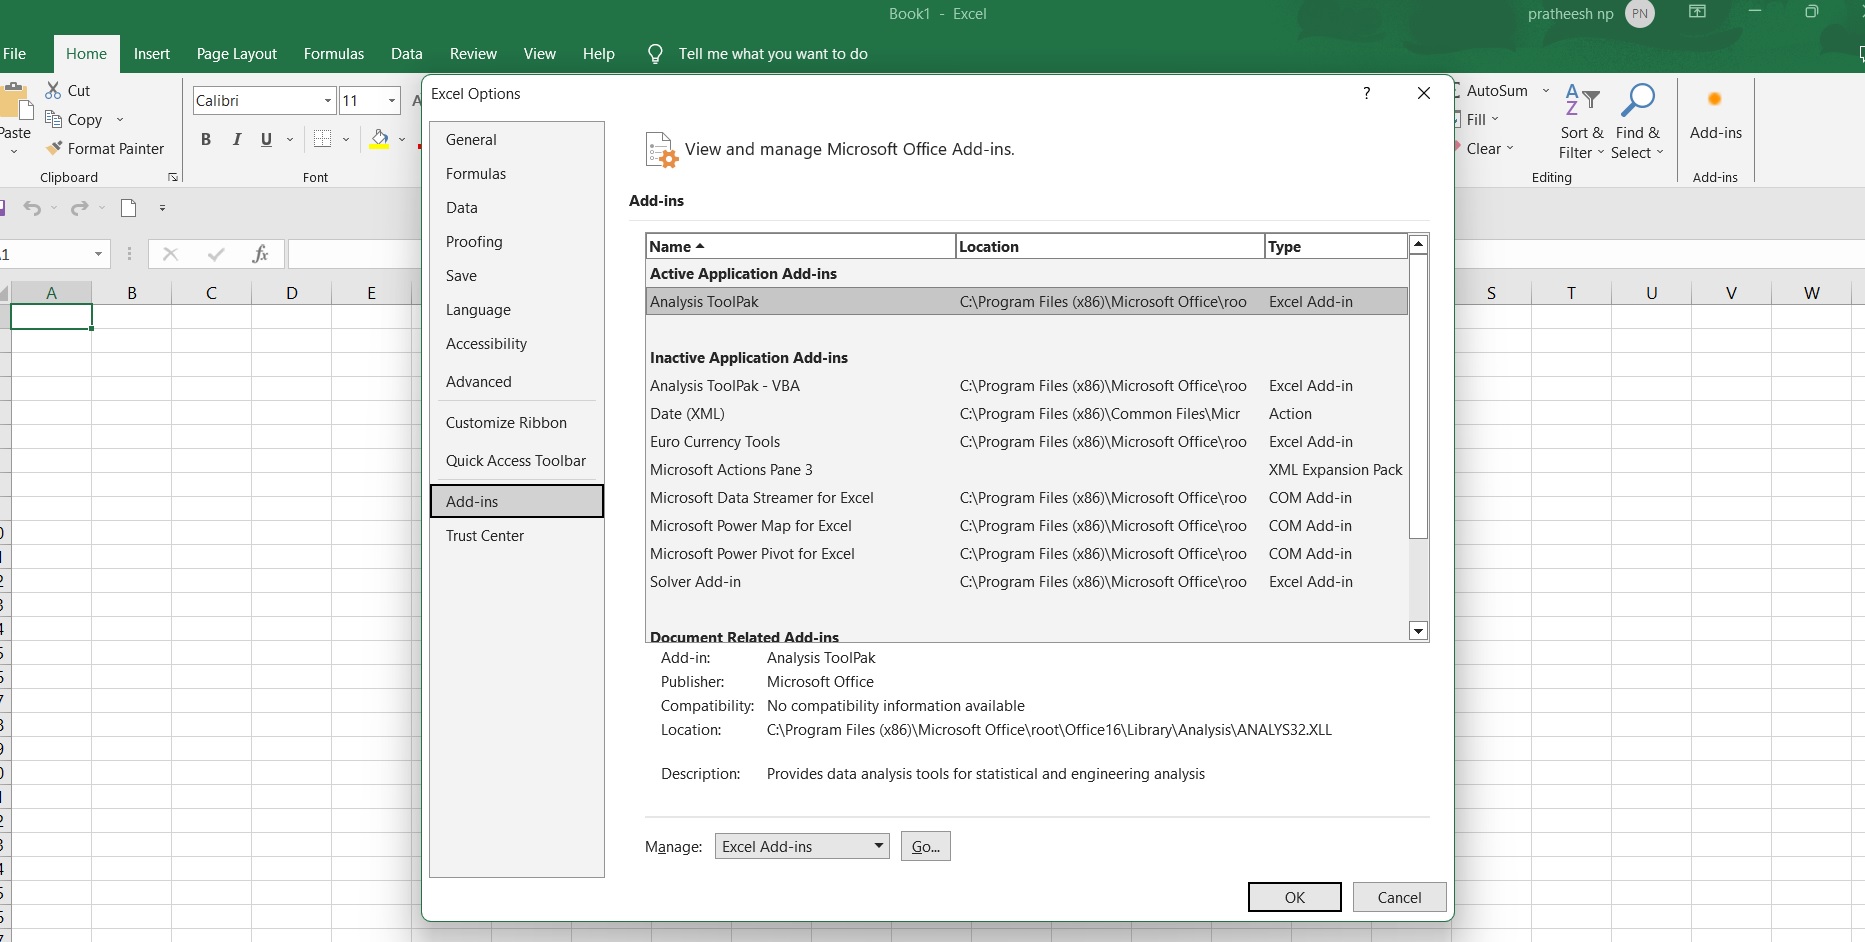
Step 3: Choose Add-Ins
In the Options window, click on the “Add-Ins” tab located on the left-hand side. The Add-Ins tab provides you with several options, including Excel Add-Ins, Outlook Add-ins, and COM Add-ins.
Step 4: Select Analysis ToolPak
Under the Add-Ins tab, select “Excel Add-Ins” and click on the “Go” button. A new window with Excel Add-Ins opens. From here, select the “Analysis ToolPak” check box and click on the “OK” button.
Note: If you are using Excel 2013 or earlier versions, the Analysis ToolPak option might be disabled by default. If this is the case, you will need to enable the Analysis ToolPak option manually.

Machine Learning Archives » Data Science Tutorials
To enable the Analysis ToolPak manually:
– Click on the “File” menu option and go to the “Options” menu.
– In the “Options” window, select the “Add-Ins” tab.
– Choose “Excel Add-Ins” and click on the “Go” button.
– From the Add-Ins window, click on the “Browse” button and find the file named “ATPVBAEN.XLAM”.
– Click on the “OK” button to load the file.
Step 5: Verify Installation
Once you have enabled the Analysis ToolPak, you can verify the installation by checking for the Data Analysis option in the Analysis group located under the Data tab.
If the Analysis group does not show, you can add it by following these steps:
– In Excel, right-click on any tab within the ribbon and select “Customize the Ribbon”.
– In the Excel Options window, click on “Customize Ribbon”.
– On the right side of the window, under the Main Tabs section, select the “Data” tab.
– Under the Main Tabs section, click on “New Group” to create a new group under the Data tab.
– Select the new group you just created, click on “Rename”, and name it “Analysis”.
– Under the right panel, in the “Choose Commands From” drop-down list, select “Commands Not in the Ribbon”.
– Scroll down to find “Data Analysis” and click on the “Add” button.
– Click on the “OK” button to save the new group.
Once you have added the new group to the Data tab, the Analysis group will now show under the Data tab.
Summary
Loading the Analysis ToolPak in Excel is straightforward and can provide you with advanced data analysis tools that are not native to Excel.
By following the steps outlined here, you can easily enable the add-in and start using the Data Analysis tools to perform complex statistical and engineering analyses.
Decision tree regression and Classification »