Skip to content

Data Science Tutorials

For Data Science Learners

  • How to copy files in R
    How to copy files in R R
  • Linear Interpolation in R
    Linear Interpolation in R-approx R
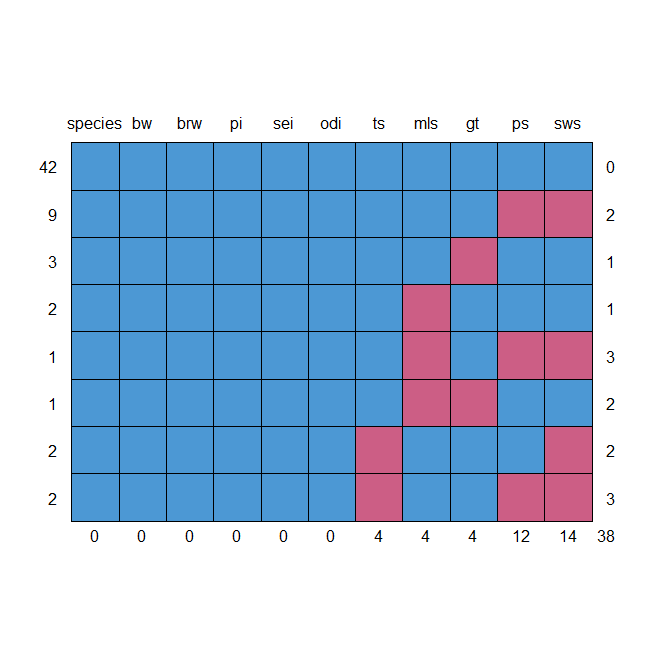
  • Dealing Missing values in R
    Dealing With Missing values in R R
  • Error in rbind(deparse.level ...) numbers of columns of arguments do not match
    Error in rbind(deparse.level …) numbers of columns of arguments do not match R
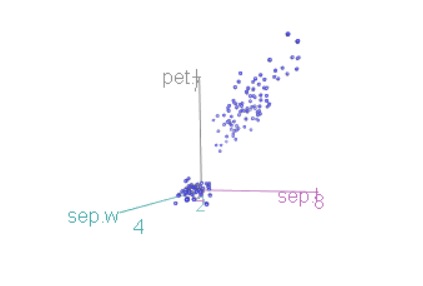
  • Interactive 3d plot in R
    Interactive 3d plot in R-Quick Guide R
  • How do confidence intervals work
    How do confidence intervals work? R
  • Multiple regression model in R R
  • How to apply a transformation to multiple columns in R?
    How to apply a transformation to multiple columns in R? R

Author: Admin

Correlation By Group in R

Posted on August 24August 24 By Admin No Comments on Correlation By Group in R

Calculating the correlation between two variables by group in R is a powerful technique that allows you to analyze the relationships between variables within specific groups. In this article, we will explore how to use the dplyr package to calculate the correlation between two variables by group. Basic Syntax The basic syntax to calculate the…

Read More “Correlation By Group in R” »

R

Best Books on Generative AI

Posted on August 22August 22 By Admin No Comments on Best Books on Generative AI

Best Books on Generative AI, Generative AI is a subset of artificial intelligence that focuses on creating new, original content, such as images, music, and text, using algorithms and machine learning techniques. This type of AI has revolutionized the way we create and interact with data, and has opened up new possibilities for industries such…

Read More “Best Books on Generative AI” »

Course, R

Multiple regression model in R

Posted on August 12August 10 By Admin No Comments on Multiple regression model in R

Multiple regression model in R, it is often necessary to fit multiple regression models to a dataset and compare the resulting coefficients from each model. One of the best ways to do this is by using the mtable() function from the memisc package in R. Multiple regression model in R The mtable() function uses the…

Read More “Multiple regression model in R” »

R

Descriptive statistics in R

Posted on August 11August 10 By Admin 2 Comments on Descriptive statistics in R

Descriptive statistics in R, it is often necessary to create a table that contains descriptive statistics for variables in a data frame. One of the best ways to do this is by using the stat.desc() function from the pastecs package in R. This function can be used to perform a variety of statistical analyses, including…

Read More “Descriptive statistics in R” »

R

How to Find the Size of a Data Frame in R

Posted on August 10August 10 By Admin No Comments on How to Find the Size of a Data Frame in R

How to Find the Size of a Data Frame in R, we will explore how to find the size of a data frame in R. A data frame is a fundamental data structure in R, and understanding its size is crucial for efficient data analysis. We will discuss three functions that can be used to…

Read More “How to Find the Size of a Data Frame in R” »

R

Filter a Vector in R

Posted on August 1July 28 By Admin No Comments on Filter a Vector in R

Filter a Vector in R is a fundamental skill that can be applied to a wide range of data analysis tasks. In this article, we’ll explore four different methods for filtering a vector in R, along with practical examples. Method 1: Filter for Elements Equal to Some Value The first method involves filtering a vector…

Read More “Filter a Vector in R” »

R

Split a Vector into Chunks in R

Posted on July 31July 28 By Admin 2 Comments on Split a Vector into Chunks in R

Split a Vector into Chunks in R can be a useful technique for manipulating and analyzing data. In this article, we’ll explore how to use the split() function in R to split a vector into chunks. Basic Syntax:Split a Vector into Chunks in R The basic syntax for splitting a vector into chunks in R…

Read More “Split a Vector into Chunks in R” »

R

Mastering the table() Function in R

Posted on July 30July 28 By Admin No Comments on Mastering the table() Function in R

Mastering the table() Function in R, The table() function in R is a powerful tool for creating frequency tables, allowing you to quickly summarize the distribution of variables in your data. In this article, we’ll explore the basics of table() and demonstrate its applications through practical examples. Step-by-Step Data Science Coding Course Syntax:Mastering the table()…

Read More “Mastering the table() Function in R” »

R

Mastering the tapply() Function in R

Posted on July 29July 28 By Admin No Comments on Mastering the tapply() Function in R

Mastering the tapply() Function in R, The tapply() function in R is a powerful tool for applying a function to a vector, grouped by another vector. In this article, we’ll delve into the basics of tapply() and explore its applications through practical examples. Data Science Applications in Banking ยป Data Science Tutorials Syntax:Mastering the tapply()…

Read More “Mastering the tapply() Function in R” »

R

Best Data Visualization Books

Posted on July 28July 28 By Admin No Comments on Best Data Visualization Books

Best Data Visualization Books, “Unlock the Power of Storytelling with Data: Transform Your Visualizations into Compelling Narratives! In this insightful book, you’ll learn the art of weaving data into captivating stories that resonate with your audience. By exploring the fundamentals of data visualization and effective communication, you’ll discover how to turn complex data into a…

Read More “Best Data Visualization Books” »

Course, R

Posts pagination

Previous 1 2 3 … 30 Next
  • Best Prompt Engineering Books
  • Understanding Machine Learning and Data Science
  • Best Git Books
  • Top 5 Books to Learn Data Engineering
  • Mastering R Programming for Data Science: Tips and Tricks
  • About Us
  • Contact
  • Disclaimer
  • Privacy Policy

https://www.r-bloggers.com

  • YouTube
  • Twitter
  • Facebook
  • Course
  • Excel
  • Machine Learning
  • Opensesame
  • R
  • Statistics

Check your inbox or spam folder to confirm your subscription.

  • Calculate the p-Value from Z-Score in R
    Calculate the p-Value from Z-Score in R R
  • Adding Subtitles in ggplot2 R
  • Error in sum(List) : invalid 'type' (list) of argument
    Error in sum(List) : invalid ‘type’ (list) of argument R
  • How to Compare Two Excel Sheets for Differences
    How to Compare Two Excel Sheets for Differences Excel
  • How to deal with text in R
    How to deal with text in R R
  • How to handle Imbalanced Data
    How to handle Imbalanced Data? R
  • Data Science Applications in Banking
    Data Science Applications in Banking Machine Learning
  • best books about data analytics
    Best Books to learn Tensorflow Course

Privacy Policy

Copyright © 2025 Data Science Tutorials.

Powered by PressBook News WordPress theme