Skip to content

Data Science Tutorials

For Data Science Learners

  • Bind together two data frames by their rows or columns in R
    Bind together two data frames by their rows or columns in R R
  • What is the best way to filter by row number in R?
    What is the best way to filter by row number in R? R
  • What Is the Best Way to Filter by Date in R
    What Is the Best Way to Filter by Date in R? R
  • How to Add Superscripts and Subscripts to Plots in R?, The basic syntax for adding superscripts or subscripts to charts in R is as follows:
    How to Add Superscripts and Subscripts to Plots in R? R
  • Separate a data frame column into multiple columns
    Separate a data frame column into multiple columns-tidyr Part3 R
  • Add new calculated variables to a data frame and drop all existing variables
    Add new calculated variables to a data frame and drop all existing variables R
  • How to Group and Summarize Data in R
    How to Group and Summarize Data in R R
  • Changing the Font Size in Base R Plots
    Changing the Font Size in Base R Plots R
bootstrapping-in-r

Bootstrapping in R

Posted on January 16January 16 By Admin No Comments on Bootstrapping in R

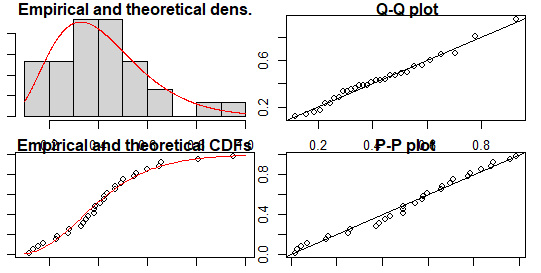
Bootstrapping in R, Inferential statistics employs a technique called bootstrapping that builds random samples of single datasets repeatedly.

Calculating sampling metrics like mean, median, mode, confidence intervals, etc. is made possible by bootstrapping.

Bootstrapping in R

The steps involved in bootstrapping using the R programming language are as follows:

  • Decide how many bootstrap samples to use.
  • Decide on each sample’s size.
  • Choose a random observation from the dataset for each sample, and add it to the sample if the sample size is less than the sample that was selected.
  • Calculate the sample’s statistic.
  • Calculate each estimated sample value’s mean.

The future of Data Science: Predictions and opportunities »

Techniques for Self-Sufficiency

Two approaches exist for bootstrapping:

Model-based resampling is another name for the technique known as residual resampling. This approach assumes that the model is accurate and that mistakes are uniformly distributed and independent.

Variables are redefined and new variables are utilized to measure the new dependent variables following each resampling.

Bootstrap Pairs: In this technique, sampling is done using pairs of the dependent and independent variables.

Example:

# Load the library
library(boot)
 
# Creating a function to pass into boot() function
bootFunc <- function(data, i){
df <- data[i, ]
c(cor(df[, 2], df[, 3]),
    median(df[, 2]),
    mean(df[, 1])
)
}
 
b <- boot(mtcars, bootFunc, R = 100)
 
print(b)
 
# Show all CI values
boot.ci(b, index = 1)
ORDINARY NONPARAMETRIC BOOTSTRAP


Call:
boot(data = mtcars, statistic = bootFunc, R = 100)


Bootstrap Statistics :
      original      bias    std. error
t1*  0.9020329 0.005836535  0.02239087
t2*  6.0000000 0.370000000  0.84870668
t3* 20.0906250 0.025187500  1.03766864
> 
> # Show all CI values
> boot.ci(b, index = 1)
BOOTSTRAP CONFIDENCE INTERVAL CALCULATIONS
Based on 100 bootstrap replicates

CALL : 
boot.ci(boot.out = b, index = 1)

Intervals : 
Level      Normal              Basic         
95%   ( 0.8523,  0.9401 )   ( 0.8488,  0.9410 )  

Level     Percentile            BCa          
95%   ( 0.8631,  0.9553 )   ( 0.8460,  0.9374 )  
Calculations and Intervals on Original Scale
Some basic intervals may be unstable
Some percentile intervals may be unstable
Warning : BCa Intervals used Extreme Quantiles
Some BCa intervals may be unstable

How to Perform a Log Rank Test in R » Data Science Tutorials

R

Post navigation

Previous Post: Hypothesis Testing in R Programming
Next Post: How to deal with text in R

Related Posts

  • How to apply a transformation to multiple columns in R?
    How to apply a transformation to multiple columns in R? R
  • Gamma distribution in R
    Gamma distribution in R R
  • How to compare the performance of different algorithms in R
    How to compare the performance of different algorithms in R? R
  • How to Turn Off Scientific Notation in R
    How to Turn Off Scientific Notation in R? R
  • Predict potential customer in R
    Predict potential customers in R R
  • Multiple regression model in R R

Leave a Reply Cancel reply

Your email address will not be published. Required fields are marked *

  • Best Prompt Engineering Books
  • Understanding Machine Learning and Data Science
  • Best Git Books
  • Top 5 Books to Learn Data Engineering
  • Mastering R Programming for Data Science: Tips and Tricks
  • About Us
  • Contact
  • Disclaimer
  • Privacy Policy

https://www.r-bloggers.com

  • YouTube
  • Twitter
  • Facebook
  • Course
  • Excel
  • Machine Learning
  • Opensesame
  • R
  • Statistics

Check your inbox or spam folder to confirm your subscription.

  • display the last value of each line in ggplot
    How to add labels at the end of each line in ggplot2? R
  • How to Use Italic Font in R
    How to Use Italic Font in R R
  • Adding Subtitles in ggplot2 R
  • How to Join Multiple Data Frames in R
    How to Join Multiple Data Frames in R R
  • How to Turn Off Scientific Notation in R
    How to Turn Off Scientific Notation in R? R
  • Subset rows based on their integer locations
    Subset rows based on their integer locations-slice in R R
  • Jarque-Bera Test in R
    Jarque-Bera Test in R With Examples R
  • How to Load the Analysis ToolPak in Excel
    How to Load the Analysis ToolPak in Excel Excel

Privacy Policy

Copyright © 2025 Data Science Tutorials.

Powered by PressBook News WordPress theme