Skip to content

Data Science Tutorials

  • Home
  • R
  • Statistics
  • Course
  • Machine Learning
  • Guest Blog
  • Contact
  • About Us
  • Toggle search form
  • Convert Multiple Columns to Numeric in R
    Convert Multiple Columns to Numeric in R R
  • Bind together two data frames by their rows or columns in R
    Bind together two data frames by their rows or columns in R R
  • How to Find Unmatched Records in R
    How to Find Unmatched Records in R R
  • Add new calculated variables to a data frame and drop all existing variables
    Add new calculated variables to a data frame and drop all existing variables R
  • gganatogram Plot in R
    How to create Anatogram plot in R R
  • Predictive Modeling and Data Science
    Predictive Modeling and Data Science Machine Learning
  • How to Analyze Likert Scale Data
    How to Analyze Likert Scale Data? Statistics
  • Control Chart in Quality Control
    Control Chart in Quality Control-Quick Guide Statistics
Gamma distribution in R

Gamma distribution in R

Posted on September 24September 23 By Jim No Comments on Gamma distribution in R
Tweet
Share
Share
Pin

Gamma distribution in R, This guide demonstrates how to use R to fit a gamma distribution to a dataset.

Gamma Distribution Fitting in R

Let’s say you have a dataset z that was produced using the following method:

Create 30 random values that are distributed according to a gamma distribution with shape parameters of 4 and 9 along with some gaussian noise.

Gama <- rgamma(30, 4, 9) + rnorm(30, 0, .03)

Now we can view the first 6 values

head(Gama)
[1] 0.1362240 0.5979568 0.4930604 0.2808689 0.4361617

With the help of the fitdistrplus package in R, we can examine how well a gamma distribution fits this dataset Gama.

if not already installed, install the ‘fitdistrplus’ package.

install.packages('fitdistrplus')

Yes, now we can load the package

library(fitdistrplus)

To fit a distribution using this package, the following general syntax should be used:

fitdist(dataset, distr = “your distribution choice”, method = “your method of fitting the data”)

In this instance, we’ll use the gamma distribution and maximum likelihood estimation approach to suit the dataset z that we created earlier:

Using mle, we fitted our dataset to a gamma distribution.

fit <- fitdist(Gama, distr = "gamma", method = "mle")

Let’s view the summary of the fit

summary(fit)

Fitting of the distribution ‘ gamma ‘ by maximum likelihood

Parameters :
      estimate Std. Error
shape 3.551416   0.647940
rate  7.019582   1.375659
Loglikelihood:  -0.1783264   AIC:  4.356653   BIC:  8.371319
Correlation matrix:
          shape      rate
shape 1.0000000 0.9309661
rate  0.9309661 1.0000000

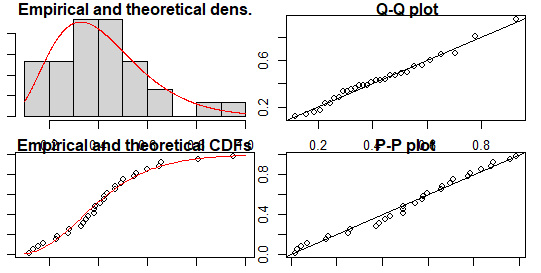
The following syntax can then be used to create several charts that demonstrate how well the gamma distribution fits the dataset.

par(mar=c(1, 1, 1, 1))
plot(fit)

Check your inbox or spam folder to confirm your subscription.

Further Resources:-
The following tutorials provide guidance on using R to manipulate various probability distributions:

The Multinomial Distribution in R – Data Science Tutorials

The Uniform Distribution in R – Data Science Tutorials

Test for Normal Distribution in R-Quick Guide – Data Science Tutorials

Tweet
Share
Share
Pin
R

Post navigation

Previous Post: Triangular Distribution in R
Next Post: Changing the Font Size in Base R Plots

Related Posts

  • Select the First Row by Group in R
    Select the First Row by Group in R R
  • How do confidence intervals work
    How do confidence intervals work? R
  • The Multinomial Distribution in R
    The Multinomial Distribution in R R
  • How to perform MANOVA test in R
    How to perform the MANOVA test in R? R
  • How to perform TBATS Model in R
    How to perform TBATS Model in R R
  • Calculate the p-Value from Z-Score in R
    Calculate the p-Value from Z-Score in R R

Leave a Reply Cancel reply

Your email address will not be published. Required fields are marked *

  • About Us
  • Contact
  • Disclaimer
  • Guest Blog
  • Privacy Policy
  • YouTube
  • Twitter
  • Facebook
  • Defensive Programming Strategies in R
  • Plot categorical data in R
  • Top Data Modeling Tools for 2023
  • Ogive Graph in R
  • Is R or Python Better for Data Science in Bangalore

Check your inbox or spam folder to confirm your subscription.

  • Data Scientist Career Path Map in Finance
  • Is Python the ideal language for machine learning
  • Convert character string to name class object
  • How to play sound at end of R Script
  • Pattern Searching in R
  • Add new calculated variables to a data frame and drop all existing variables
    Add new calculated variables to a data frame and drop all existing variables R
  • Checking Missing Values in R
    Checking Missing Values in R R
  • display the last value of each line in ggplot
    How to add labels at the end of each line in ggplot2? R
  • Ogive Graph in R
    Ogive Graph in R R
  • ggpairs in R
    ggpairs in R R
  • ggdogs on ggplot2
    ggdogs on ggplot2 R
  • Random Forest Machine Learning
    Random Forest Machine Learning Introduction R
  • Survival Plot in R
    How to Perform a Log Rank Test in R R

Copyright © 2023 Data Science Tutorials.

Powered by PressBook News WordPress theme