Skip to content

Data Science Tutorials

For Data Science Learners

  • Home
  • R
  • Statistics
  • Course
  • Machine Learning
  • Contact
  • About Us
  • Toggle search form
  • How to Calculate Relative Frequencies in R
    How to Calculate Relative Frequencies in R? R
  • How to Check if a Directory Exists in R
    How to Check if a Directory Exists in R R
  • How to Use “not in” operator in Filter
    How to Use “not in” operator in Filter R
  • sorting in r
    Sorting in r: sort, order & rank R Functions R
  • stacked barplot in R
    Stacked Barplot in R R
  • Cross-validation in Machine Learning
    Cross-validation in Machine Learning Statistics
  • Create new variables from existing variables in R
    Create new variables from existing variables in R R
  • How to Join Multiple Data Frames in R
    How to Join Multiple Data Frames in R R

Category: R

R for Data Science

How to create contingency tables in R?

Posted on May 3May 12 By Admin No Comments on How to create contingency tables in R?
How to create contingency tables in R?

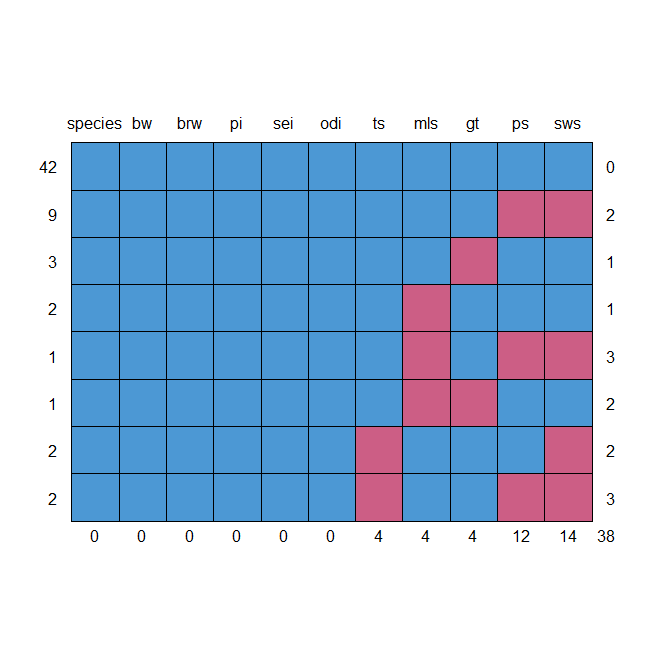
Create contingency tables in R, Contingency tables are helpful for condensing a huge number of observations into smaller, more manageable tables. We’ll learn about contingency tables and how to make them in this R tutorial. Complex/flat tables, cross-tabulation, and recovering original data from contingency tables will all be covered. As you can see, this course…

Read More “How to create contingency tables in R?” »

R

Methods for Integrating R and Hadoop complete Guide

Posted on May 3May 12 By Admin No Comments on Methods for Integrating R and Hadoop complete Guide
Methods for Integrating R and Hadoop complete Guide

In this lesson, we’ll look at how to integrate R with Hadoop. For Big Data analysis, we’ll show you a variety of R and Hadoop integration strategies. When it comes to large data, R is the go-to tool for data scientists and analysts. It may be ideal for many data science jobs, but when it…

Read More “Methods for Integrating R and Hadoop complete Guide” »

R

Detecting and Dealing with Outliers: First Step

Posted on May 1May 12 By Admin No Comments on Detecting and Dealing with Outliers: First Step
Detecting and Dealing with Outliers: First Step

Detecting and Dealing with Outliers, We’re going to look a little bit more at these mammals’ sleep data. Let’s take a summary of them. library(mice) summary(mammalsleep)  species bw brw African elephant : 1 Min. : 0.005 Min. : 0.14 African giant pouched rat: 1 1st Qu.: 0.600 1st Qu.: 4.25 Arctic Fox : 1 Median…

Read More “Detecting and Dealing with Outliers: First Step” »

R

Dealing With Missing values in R

Posted on April 28April 30 By Admin No Comments on Dealing With Missing values in R
Dealing With Missing values in R

Dealing With Missing Values in R, one of the issues is that when you have a large matrix of data and some of the columns have a few missing values, it might be difficult to work with. Checking Missing Values in R – (datasciencetut.com) You won’t be able to perform a lot of multivariate or…

Read More “Dealing With Missing values in R” »

R

Checking Missing Values in R

Posted on April 27April 30 By Admin No Comments on Checking Missing Values in R
Checking Missing Values in R

Checking Missing Values in R, we’ll undertake data wrangling, which is the pre-processing and preparation of data. In fact, practicing data science will consume more than 70% of your time. We’ll only look at a few of the most important commands to make things as simple as possible. However, you will devote a significant amount…

Read More “Checking Missing Values in R” »

R

Best GGPlot Themes You Should Know

Posted on April 26April 30 By Admin No Comments on Best GGPlot Themes You Should Know
Best GGPlot Themes You Should Know

Best GGPlot Themes, This tutorial covers everything you need to know about the greatest ggplot2 themes, including. How to use the built-in ggplot2 themes to change the appearance of plots. How to change the appearance of plots using the ggthemes library’s predefined themes. How to change the plot panel background and gridlines, as well as…

Read More “Best GGPlot Themes You Should Know” »

R

Quantiles by Group calculation in R with examples

Posted on April 24April 30 By Admin No Comments on Quantiles by Group calculation in R with examples
Quantiles by Group calculation in R with examples

Quantiles by Group calculation in R, Quantiles are numbers in statistics that divide a ranking dataset into equal groups. In R, we can use the following functions from the dplyr package to calculate quantiles grouped by a certain variable. library(dplyr) Identify the quantiles that you’re interested in. q<-c(0.25, 0.5, 0.80) Quantiles are calculated by grouping…

Read More “Quantiles by Group calculation in R with examples” »

R

How to Use the Multinomial Distribution in R?

Posted on April 23April 30 By Admin 3 Comments on How to Use the Multinomial Distribution in R?
How to Use the Multinomial Distribution in R?

Multinomial Distribution in R, when each result has a given probability of occurring, the multinomial distribution describes the likelihood of obtaining a specific number of counts for k different outcomes. A statistical experiment with n repeated trials is known as a multinomial experiment. There are a finite number of possible outcomes in each trial. The…

Read More “How to Use the Multinomial Distribution in R?” »

R

Get the first value in each group in R?

Posted on April 23April 30 By Admin No Comments on Get the first value in each group in R?
Get the first value in each group in R?

Get the first value in each group in R, Knowing the first, last, or nth value in the group can be important at times. With the help of various examples, we will look at how to retrieve the initial value for each group in this article. The aggregate() or group by() functions in R can…

Read More “Get the first value in each group in R?” »

R

How to get the last value of each group in R

Posted on April 23April 30 By Admin No Comments on How to get the last value of each group in R
How to get the last value of each group in R

How to get the last value of each group in r, the aggregate() or group by() functions in R can be used to get the last value of each group. Let’s have a look at how to? Obtain the most recent value for each group – group by a single column. Get each group’s most…

Read More “How to get the last value of each group in R” »

R

Posts navigation

Previous 1 … 20 21 22 Next
  • Descriptive Statistics in R
  • Multiple Plots to PDF in R
  • Run a specific code block in R
  • Replace first match in R
  • Display the structure in R
  • About Us
  • Contact
  • Disclaimer
  • Privacy Policy

https://www.r-bloggers.com

  • YouTube
  • Twitter
  • Facebook
  • Course
  • Excel
  • Machine Learning
  • Opensesame
  • R
  • Statistics

Check your inbox or spam folder to confirm your subscription.

  • Crosstab calculation in R
    Crosstab calculation in R R
  • Survival Plot in R
    How to Perform a Log Rank Test in R R
  • Group By Sum in R
    Group By Sum in R R
  • Convert Multiple Columns to Numeric in R
    Convert Multiple Columns to Numeric in R R
  • How to add columns to a data frame in R
    How to add columns to a data frame in R R
  • In data science, what Is Open Innovation?
    In data science, what Is Open Innovation? R
  • Statistical test assumptions and requirements
    Statistical test assumptions and requirements Statistics
  • R Percentage by Group Calculation
    R Percentage by Group Calculation R

Privacy Policy

Copyright © 2024 Data Science Tutorials.

Powered by PressBook News WordPress theme