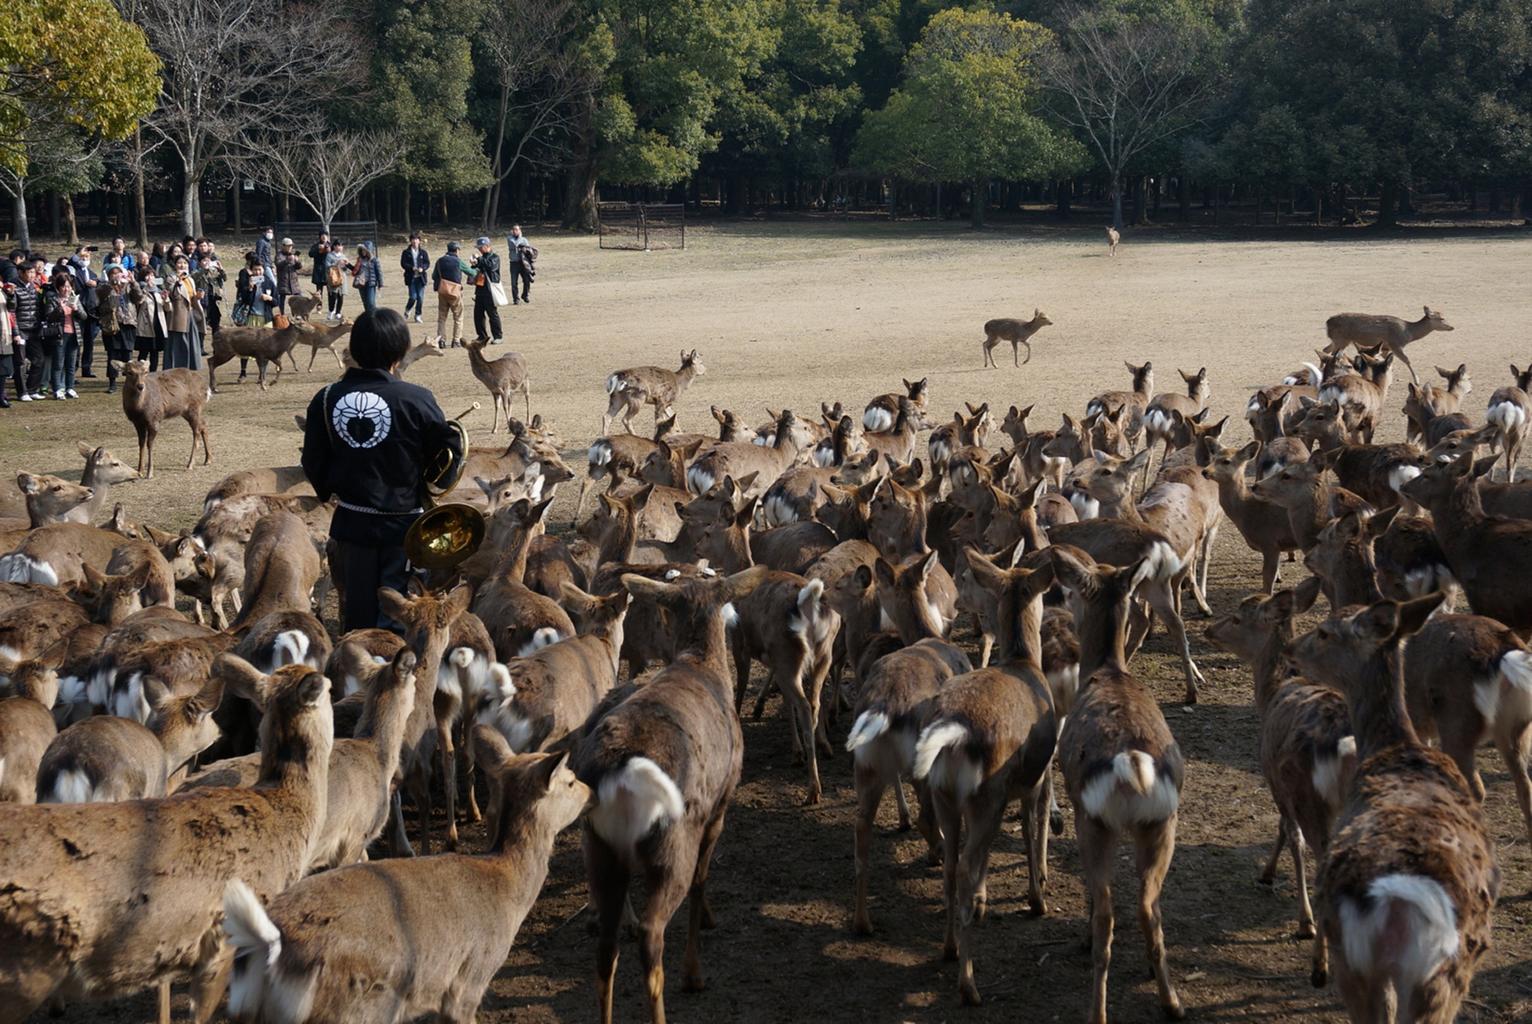


Detecting and Dealing with Outliers, We’re going to look a little bit more at these mammals’ sleep data.
Let’s take a summary of them.
library(mice)
summary(mammalsleep)
 species         bw                brw
 African elephant         : 1   Min.   :   0.005   Min.   :   0.14
 African giant pouched rat: 1   1st Qu.:   0.600   1st Qu.:   4.25
 Arctic Fox               : 1   Median :   3.342   Median :  17.25
 Arctic ground squirrel   : 1   Mean   : 198.790   Mean   : 283.13
 Asian elephant           : 1   3rd Qu.:  48.202   3rd Qu.: 166.00
 Baboon                   : 1   Max.   :6654.000   Max.   :5712.00
 (Other)                  :56

      sws               ps              ts             mls
 Min.   : 2.100   Min.   :0.000   Min.   : 2.60   Min.   :  2.000
 1st Qu.: 6.250   1st Qu.:0.900   1st Qu.: 8.05   1st Qu.:  6.625
 Median : 8.350   Median :1.800   Median :10.45   Median : 15.100
 Mean   : 8.673   Mean   :1.972   Mean   :10.53   Mean   : 19.878
 3rd Qu.:11.000   3rd Qu.:2.550   3rd Qu.:13.20   3rd Qu.: 27.750
 Max.   :17.900   Max.   :6.600   Max.   :19.90   Max.   :100.000
 NA's   :14       NA's   :12      NA's   :4       NA's   :4

       gt               pi             sei             odi
 Min.   : 12.00   Min.   :1.000   Min.   :1.000   Min.   :1.000
 1st Qu.: 35.75   1st Qu.:2.000   1st Qu.:1.000   1st Qu.:1.000
 Median : 79.00   Median :3.000   Median :2.000   Median :2.000
 Mean   :142.35   Mean   :2.871   Mean   :2.419   Mean   :2.613
 3rd Qu.:207.50   3rd Qu.:4.000   3rd Qu.:4.000   3rd Qu.:4.000
 Max.   :645.00   Max.   :5.000   Max.   :5.000   Max.   :5.000
 NA's   :4
So, if you use the summary command, it will automatically take a data frame and try to figure out all of the information about it, as well as how to summarise each column independently.
How to perform One-Sample Wilcoxon Signed Rank Test in R?
Here we have the various species, which is the first variable (it’s not the row names, it’s the first variable), and it indicates that you have one of each. There are 56 that aren’t included in this list.
But that’s not the case with the others. They’re all labeled with the correct species.
The first one we notice is this body mass, which is also known as body weight, and we can see that the range, from minimal to maximum, is really wide.
Detecting and Dealing with Outliers
So, this is an occasion to point out that you should be on the lookout for values that are significantly different from others, which we refer to as outliers.
So, for example, if we go in and ask, “What is the maximum of the mammalsleep$bw?”
which.max(mammalsleep$bw)
and it tells us 1 and so, that’s because out of all the weights, We can look at the real culprit here.
This tells us that the African elephant is actually the largest, and these are the values we have for them. Let’s look at the bare minimum.
Best GGPlot Themes You Should Know – (datasciencetut.com)
mammalsleep[which.min(mammalsleep$bw),]
species
32 Lesser short-tailed shrew
      bw  brw sws  ps  ts mls
32 0.005 0.14 7.7 1.4 9.1 2.6
     gt pi sei odi
32 21.5  5   2   4
Both of these, this being the lesser short-tailed shrew, are reasonable.
That is, they are not errors, therefore you may obtain the maximum and the value is, for example,
Because it’s 9,999, but it doesn’t make sense, and you have something that does, so if we discovered a possum that was 9,999, that was bigger than the elephant.
That was an encoding of a missing variable to us, but it’s not a valid value.
So, in order to accomplish imputation, I’d have to substitute the numerical value with a genuine missing value.
As a result, documenting and looking for outliers is useful as a data double-check.
There are numerous issues that arise due to typos and values that are merged together, as well as missing columns, which cause your data to provide absolutely absurd results, and it is your obligation to correct them.
This is something that the computer can assist you with, but you must become involved in all elements of the process.
So, taking a look at the maximum and minimum is a good approach to go about it.
So here’s what we do: you have to document everything. I’ve discovered this value, and this is the largest, and this is the smallest, so make notes for yourself and the people for whom you’re writing the report.
So that everyone is aware that these are the extreme points and that what they know should be consistent.