Skip to content

Data Science Tutorials

For Data Science Learners

  • How to apply a transformation to multiple columns in R?
    How to apply a transformation to multiple columns in R? R
  • What is bias variance tradeoff
    What is the bias variance tradeoff? R
  • Tips for Data Scientist Interview Openings
    Tips for Data Scientist Interview Openings Course
  • Group By Sum in R
    Group By Sum in R R
  • A Side-by-Side Boxplot in R
    A Side-by-Side Boxplot in R: How to Do It R
  • How to Display Percentages on Histogram IN R
    How to Display Percentages on Histogram in R R
  • R Percentage by Group Calculation
    R Percentage by Group Calculation R
  • How to compare variances in R
    How to compare variances in R R

Tag: onewayANOVA

One way ANOVA Example in R-Quick Guide

Posted on May 10May 12 By Admin No Comments on One way ANOVA Example in R-Quick Guide
One way ANOVA Example in R-Quick Guide

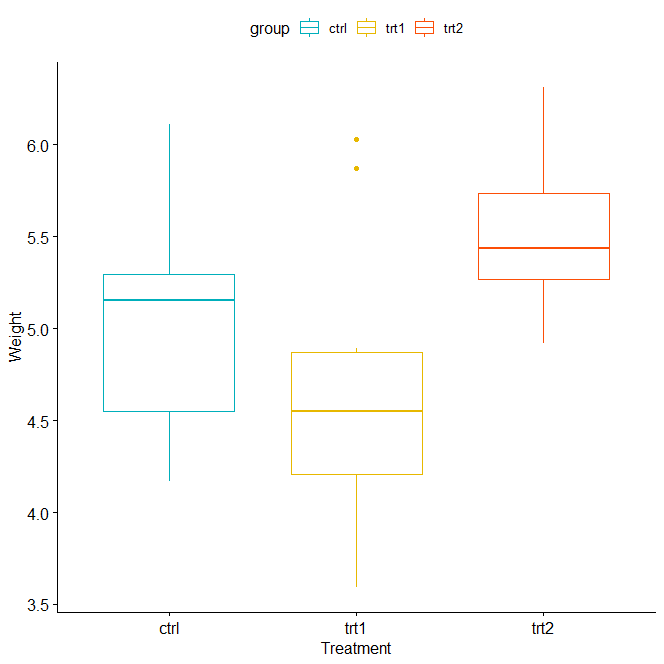
One way ANOVA Example in R, the one-way analysis of variance (ANOVA), also known as one-factor ANOVA, is an extension of the independent two-sample t-test for comparing means when more than two groups are present. The data is divided into numerous groups using one single grouping variable in one-way ANOVA (also called factor variable). The…

Read More “One way ANOVA Example in R-Quick Guide” »

R
  • Maximizing Model Accuracy with Train-Test Splits in Machine Learning
  • Type II Errors in R
  • Best Prompt Engineering Books
  • Understanding Machine Learning and Data Science
  • Best Git Books
  • About Us
  • Contact
  • Disclaimer
  • Privacy Policy

https://www.r-bloggers.com

  • YouTube
  • Twitter
  • Facebook
  • Course
  • Excel
  • Machine Learning
  • Opensesame
  • R
  • Statistics

Check your inbox or spam folder to confirm your subscription.

  • Best Data Science YouTube Tutorials
    Best Data Science YouTube Tutorials Free to Learn Course
  • Crosstab calculation in R
    Crosstab calculation in R R
  • How to Use Mutate function in R
    How to Use Mutate function in R R
  • How to Change X-Axis Labels of Barplot In R
    How to Change X-Axis Labels of Barplot In R R
  • Lottery Prediction Using Machine Learning
    Lottery Prediction Using Machine Learning Machine Learning
  • How to change the column positions in R?
    How to change the column positions in R? R
  • Interactive 3d plot in R
    Interactive 3d plot in R-Quick Guide R
  • Error in solve.default(mat)  Lapack routine dgesv system is exactly singular
    Error in solve.default(mat) :  Lapack routine dgesv: system is exactly singular: U[2,2] = 0 R

Privacy Policy

Copyright © 2025 Data Science Tutorials.

Powered by PressBook News WordPress theme