Skip to content

Data Science Tutorials

For Data Science Learners

  • How do confidence intervals work
    How do confidence intervals work? R
  • pheatmap function in R
    The pheatmap function in R R
  • Best Data Science YouTube Tutorials
    Best Data Science YouTube Tutorials Free to Learn Course
  • How to create a ggalluvial plot in r
    How to create a ggalluvial plot in R? R
  • AI in Delivery Management
    AI in Delivery Management Machine Learning
  • How to Implement the Sklearn Predict Approach
    How to Implement the Sklearn Predict Approach? R
  • How to Find Optimal Clusters in R, K-means clustering is one of the most widely used clustering techniques in machine learning.
    How to Find Optimal Clusters in R? R
  • Random Forest Machine Learning
    Random Forest Machine Learning Introduction R

Search Results for: ggplot

Adding Subtitles in ggplot2

Posted on August 24August 24 By Admin No Comments on Adding Subtitles in ggplot2

Adding Subtitles in ggplot2, Data visualization is a critical aspect of data analysis, allowing for the communication of complex data in a manner that is accessible and understandable. One of the most popular packages for creating visualizations in R is ggplot2, which stands out for its versatility and ease of use. In this article, we…

Read More “Adding Subtitles in ggplot2” »

R

Add Footnote to ggplot2

Posted on August 24August 24 By Admin No Comments on Add Footnote to ggplot2

Adding a footnote to a ggplot2 plot in R can enhance the information presented by providing additional context or source attribution. Add Footnote to ggplot2 To add a footnote, you can utilize the labs() function with the caption argument. Here’s a simple example to illustrate this: Free Data Science Books » EBooks » finnstats #…

Read More “Add Footnote to ggplot2” »

R

ggdogs on ggplot2

Posted on October 21October 21 By Admin 1 Comment on ggdogs on ggplot2
ggdogs on ggplot2

ggdogs on ggplot2, With the help of the function instead of, you may use the package to add dog-related photos in place of dots in ggplot2. ggdogsgeom_doggeom_point You can send any of the sentences listed above to the feature to use the associated dog images. There are currently 15 different breeds of dogs accessible, called…

Read More “ggdogs on ggplot2” »

R

How to Add a caption to ggplot2 Plots in R?

Posted on September 1September 1 By Admin No Comments on How to Add a caption to ggplot2 Plots in R?
How to Add a caption to ggplot2 Plots in R?

How to Add a caption to ggplot2 Plots in R?, the graphs in ggplot2 can have captions added using one of the methods listed below. With the following data frame in R, the following examples demonstrate how to use each technique in practice. A Side-by-Side Boxplot in R: How to Do It – Data Science…

Read More “How to Add a caption to ggplot2 Plots in R?” »

R

How to Label Outliers in Boxplots in ggplot2?

Posted on August 19August 19 By Admin No Comments on How to Label Outliers in Boxplots in ggplot2?
How to Label Outliers in Boxplots in ggplot2?

How to Label Outliers in Boxplots in ggplot2, This article offers a detailed illustration of how to name outliers in ggplot2 boxplots. Step 1: Construct the data frame. Create the following data frame first, which will include details on the 60 distinct basketball players who played for three separate teams and scored points. How to…

Read More “How to Label Outliers in Boxplots in ggplot2?” »

R

How to add labels at the end of each line in ggplot2?

Posted on May 25May 25 By Admin No Comments on How to add labels at the end of each line in ggplot2?
How to add labels at the end of each line in ggplot2?

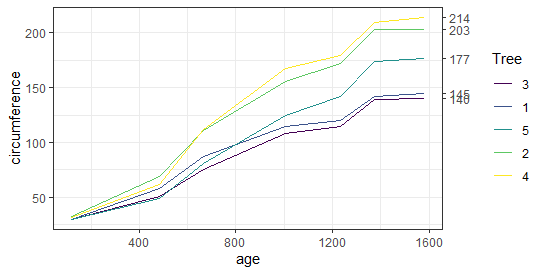
How to add labels at the end of each line in ggplot2?, Using the ggplot2 R library, this article shows how to display the last value of each line as a label. Using either the ggrepel text labeling or the ggplot2 secondary axis functions, many methods are shown. Test for Normal Distribution in R-Quick Guide…

Read More “How to add labels at the end of each line in ggplot2?” »

R

Change ggplot2 Theme Color in R ggthemr Package

Posted on May 15May 15 By Admin No Comments on Change ggplot2 Theme Color in R ggthemr Package
Change ggplot2 Theme Color in R ggthemr Package

 In this article, you’ll learn how to change the colors of ggplot2 visuals in the R programming language by utilizing different themes. Let’s start by making some sample data in R. set.seed(123)                             df <- data.frame(x = rnorm(100),                    y = rnorm(100),                    group = paste0(“group_”, LETTERS[1:5])) head(df)                                       x          y   group 1  0.7842588 -0.3663221 group_A 2 …

Read More “Change ggplot2 Theme Color in R ggthemr Package” »

R

Best GGPlot Themes You Should Know

Posted on April 26April 30 By Admin No Comments on Best GGPlot Themes You Should Know
Best GGPlot Themes You Should Know

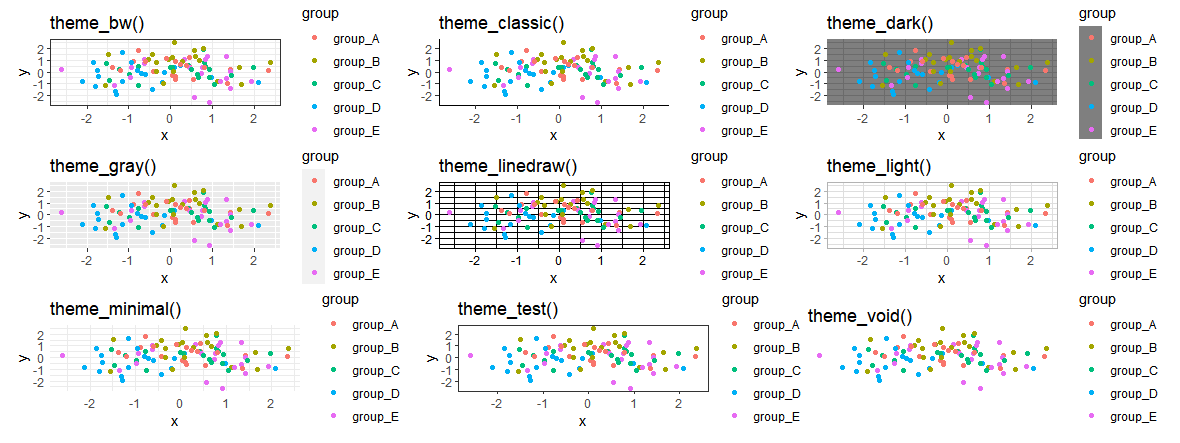
Best GGPlot Themes, This tutorial covers everything you need to know about the greatest ggplot2 themes, including. How to use the built-in ggplot2 themes to change the appearance of plots. How to change the appearance of plots using the ggthemes library’s predefined themes. How to change the plot panel background and gridlines, as well as…

Read More “Best GGPlot Themes You Should Know” »

R

Mastering R Programming for Data Science: Tips and Tricks

Posted on September 25September 25 By Admin No Comments on Mastering R Programming for Data Science: Tips and Tricks

Mastering R Programming for Data Science: Tips and Tricks, As data science continues to evolve, the demand for R programming skills has become a necessary tool for data professionals to extract insights from data rapidly. R is a powerful language that offers a wide range of tasks, including statistics, visualization, and machine learning. Mastering R…

Read More “Mastering R Programming for Data Science: Tips and Tricks” »

R

R-Change Number of Bins in Histogram

Posted on September 4September 4 By Admin No Comments on R-Change Number of Bins in Histogram

R-Change Number of Bins in Histogram, the default number of bins is determined by Sturges’ Rule. However, you can override this rule by specifying a specific number of bins using the breaks argument in the hist function. R-Change Number of Bins in Histogram For example, to create a histogram with 7 bins, you can use…

Read More “R-Change Number of Bins in Histogram” »

R

Posts pagination

1 2 … 8 Next
  • Best Prompt Engineering Books
  • Understanding Machine Learning and Data Science
  • Best Git Books
  • Top 5 Books to Learn Data Engineering
  • Mastering R Programming for Data Science: Tips and Tricks
  • About Us
  • Contact
  • Disclaimer
  • Privacy Policy

https://www.r-bloggers.com

  • YouTube
  • Twitter
  • Facebook
  • Course
  • Excel
  • Machine Learning
  • Opensesame
  • R
  • Statistics

Check your inbox or spam folder to confirm your subscription.

  • What is the best way to filter by row number in R?
    What is the best way to filter by row number in R? R
  • Best Prompt Engineering Books R
  • How to change the column positions in R?
    How to change the column positions in R? R
  • Aggregate daily data to monthly and yearly in R
    Aggregate daily data to monthly and yearly in R R
  • one-sample-proportion-test-in-r
    One sample proportion test in R-Complete Guide R
  • AI in Delivery Management
    AI in Delivery Management Machine Learning
  • Predictive Modeling and Data Science
    Predictive Modeling and Data Science Machine Learning
  • Top Data Science Skills
    Top Data Science Skills- step by step guide Machine Learning

Privacy Policy

Copyright © 2025 Data Science Tutorials.

Powered by PressBook News WordPress theme