Skip to content

Data Science Tutorials

For Data Science Learners

  • Home
  • R
  • Statistics
  • Course
  • Machine Learning
  • Contact
  • About Us
  • Toggle search form
  • Data Scientist in 2023
    How to Become a Data Scientist in 2023 Machine Learning
  • How to Scale Only Numeric Columns in R
    How to Scale Only Numeric Columns in R R
  • How to Filter Rows In R
    How to Filter Rows In R? R
  • The Uniform Distribution in R
    The Uniform Distribution in R R
  • Cross product of transpose of matrix in R R
  • Subset rows based on their integer locations
    Subset rows based on their integer locations-slice in R R
  • Error attempt to apply non function in r
    Error attempt to apply non function in r R
  • Methods for Integrating R and Hadoop
    Methods for Integrating R and Hadoop complete Guide R

Author: Admin

Remove Rows from the data frame in R

Posted on June 3June 3 By Admin No Comments on Remove Rows from the data frame in R
Remove Rows from the data frame in R

Remove Rows from the data frame in R, To remove rows from a data frame in R using dplyr, use the following basic syntax. Detecting and Dealing with Outliers: First Step – Data Science Tutorials 1. Remove any rows containing NA’s. df %>%  na.omit() 2. Remove any rows in which there are no NAs in…

Read More “Remove Rows from the data frame in R” »

R

Arrange the rows in a specific sequence in R

Posted on June 2June 2 By Admin No Comments on Arrange the rows in a specific sequence in R
Arrange the rows in a specific sequence in R

Arrange the rows in a specific sequence in R, Frequently, you’ll want to arrange the rows in a data frame in R in a specified order. Fortunately, the arrange() function from the dplyr library makes this simple. Using the data frame below, this tutorial shows numerous examples of how to utilize this function in practice….

Read More “Arrange the rows in a specific sequence in R” »

R

Arrange Data by Month in R with example

Posted on June 1June 1 By Admin No Comments on Arrange Data by Month in R with example
Arrange Data by Month in R with example

Arrange Data by Month in R, To easily arrange data by month, use the floor_date() function from the lubridate package in R. The following is the fundamental syntax for this function. library(tidyverse) df %>%     group_by(month = lubridate::floor_date(date_column, ‘month’)) %>%     summarize(sum = sum(value_column)) The example below demonstrates how to utilize this function in practice….

Read More “Arrange Data by Month in R with example” »

R

Interactive 3d plot in R-Quick Guide

Posted on May 31May 31 By Admin No Comments on Interactive 3d plot in R-Quick Guide
Interactive 3d plot in R-Quick Guide

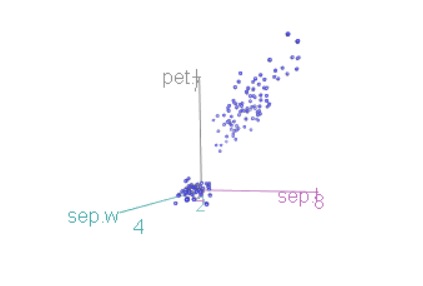
Interactive 3d plot in R, This R lesson shows how to create dynamic 3d graphics with R and the scatter3d function from the package car. The rgl package is used by the scatter3d() function to draw and animate 3D scatter plots. Install and load all necessary packages. For this tutorial, you’ll need the rgl and…

Read More “Interactive 3d plot in R-Quick Guide” »

R

How to Perform a Log Rank Test in R

Posted on May 30May 30 By Admin No Comments on How to Perform a Log Rank Test in R
How to Perform a Log Rank Test in R

 How to Perform a Log Rank Test in R, The most frequent technique to compare survival curves between two groups is to use a log-rank test. The following hypotheses are used in this test H0: There is no difference in survival between the two groups. HA: There is a difference in survival between the two…

Read More “How to Perform a Log Rank Test in R” »

R

How to compare variances in R

Posted on May 29May 29 By Admin No Comments on How to compare variances in R
How to compare variances in R

How to compare variances in R?, The F-test is used to see if two populations (A and B) have the same variances. When should the F-test be used? A comparison of two variations is useful in a variety of situations, including: When you wish to examine if the variances of two samples are equal, you…

Read More “How to compare variances in R” »

R

Best Books on Data Science with Python

Posted on May 28August 22 By Admin No Comments on Best Books on Data Science with Python
Best Books on Data Science with Python

Best Books on Data Science with Python, In the subject of data science, Python is one of the most extensively used programming languages. Pandas, NumPy, scikit-learn, Matplotlib, and SciPy are just a few of the Python packages and libraries that are specifically suited for specific functions. So, if you’re seeking the Best Books on Python…

Read More “Best Books on Data Science with Python” »

Course

Two Sample Proportions test in R-Complete Guide

Posted on May 28May 27 By Admin No Comments on Two Sample Proportions test in R-Complete Guide
Two Sample Proportions test in R-Complete Guide

Two Sample Proportions test in R, To compare two observed proportions, the two-proportions z-test is utilized. This article explains the fundamentals of the two-proportions *z-test and gives practical examples using R software. We have two groups of people, for example: Best GGPlot Themes You Should Know – Data Science Tutorials n = 500 in Group…

Read More “Two Sample Proportions test in R-Complete Guide” »

R

Calculate the P-Value from Chi-Square Statistic in R

Posted on May 27May 27 By Admin No Comments on Calculate the P-Value from Chi-Square Statistic in R
Calculate the P-Value from Chi-Square Statistic in R

Calculate the P-Value from Chi-Square Statistic in R, You’ll get a Chi-Square test statistic every time you run a Chi-Square test. The p-value associated with this test statistic can then be used to assess if the test findings are statistically significant. Calculate the p-Value from Z-Score in R – Data Science Tutorials The pchisq() function…

Read More “Calculate the P-Value from Chi-Square Statistic in R” »

R

Calculate the p-Value from Z-Score in R

Posted on May 27May 27 By Admin No Comments on Calculate the p-Value from Z-Score in R
Calculate the p-Value from Z-Score in R

Calculate the p-Value from Z-Score in R, In statistics, we frequently want to know the p-value associated with a specific z-score obtained from a hypothesis test. We can reject the null hypothesis of our hypothesis test if this p-value is less than a certain level of significance. How to create contingency tables in R? –…

Read More “Calculate the p-Value from Z-Score in R” »

R

Posts navigation

Previous 1 … 22 23 24 … 27 Next
  • Calculating Autocorrelation in R
  • Calculating Z-Scores in R: A Step-by-Step Guide
  • Descriptive Statistics in R
  • Multiple Plots to PDF in R
  • Run a specific code block in R
  • About Us
  • Contact
  • Disclaimer
  • Privacy Policy

https://www.r-bloggers.com

  • YouTube
  • Twitter
  • Facebook
  • Course
  • Excel
  • Machine Learning
  • Opensesame
  • R
  • Statistics

Check your inbox or spam folder to confirm your subscription.

  • How to Join Multiple Data Frames in R
    How to Join Multiple Data Frames in R R
  • Data Science Challenges in R Programming Language
    Data Science Challenges in R Programming Language Machine Learning
  • Making games in R- Nara and eventloop Game Changers
    Making games in R- Nara and eventloop Game Changers Machine Learning
  • Best Online Course For Statistics
    Free Best Online Course For Statistics Course
  • Defensive Programming Strategies in R
    Defensive Programming Strategies in R Machine Learning
  • Calculate the p-Value from Z-Score in R
    Calculate the p-Value from Z-Score in R R
  • stacked barplot in R
    Stacked Barplot in R R
  • How to Avoid Overfitting
    How to Avoid Overfitting? Machine Learning

Privacy Policy

Copyright © 2024 Data Science Tutorials.

Powered by PressBook News WordPress theme