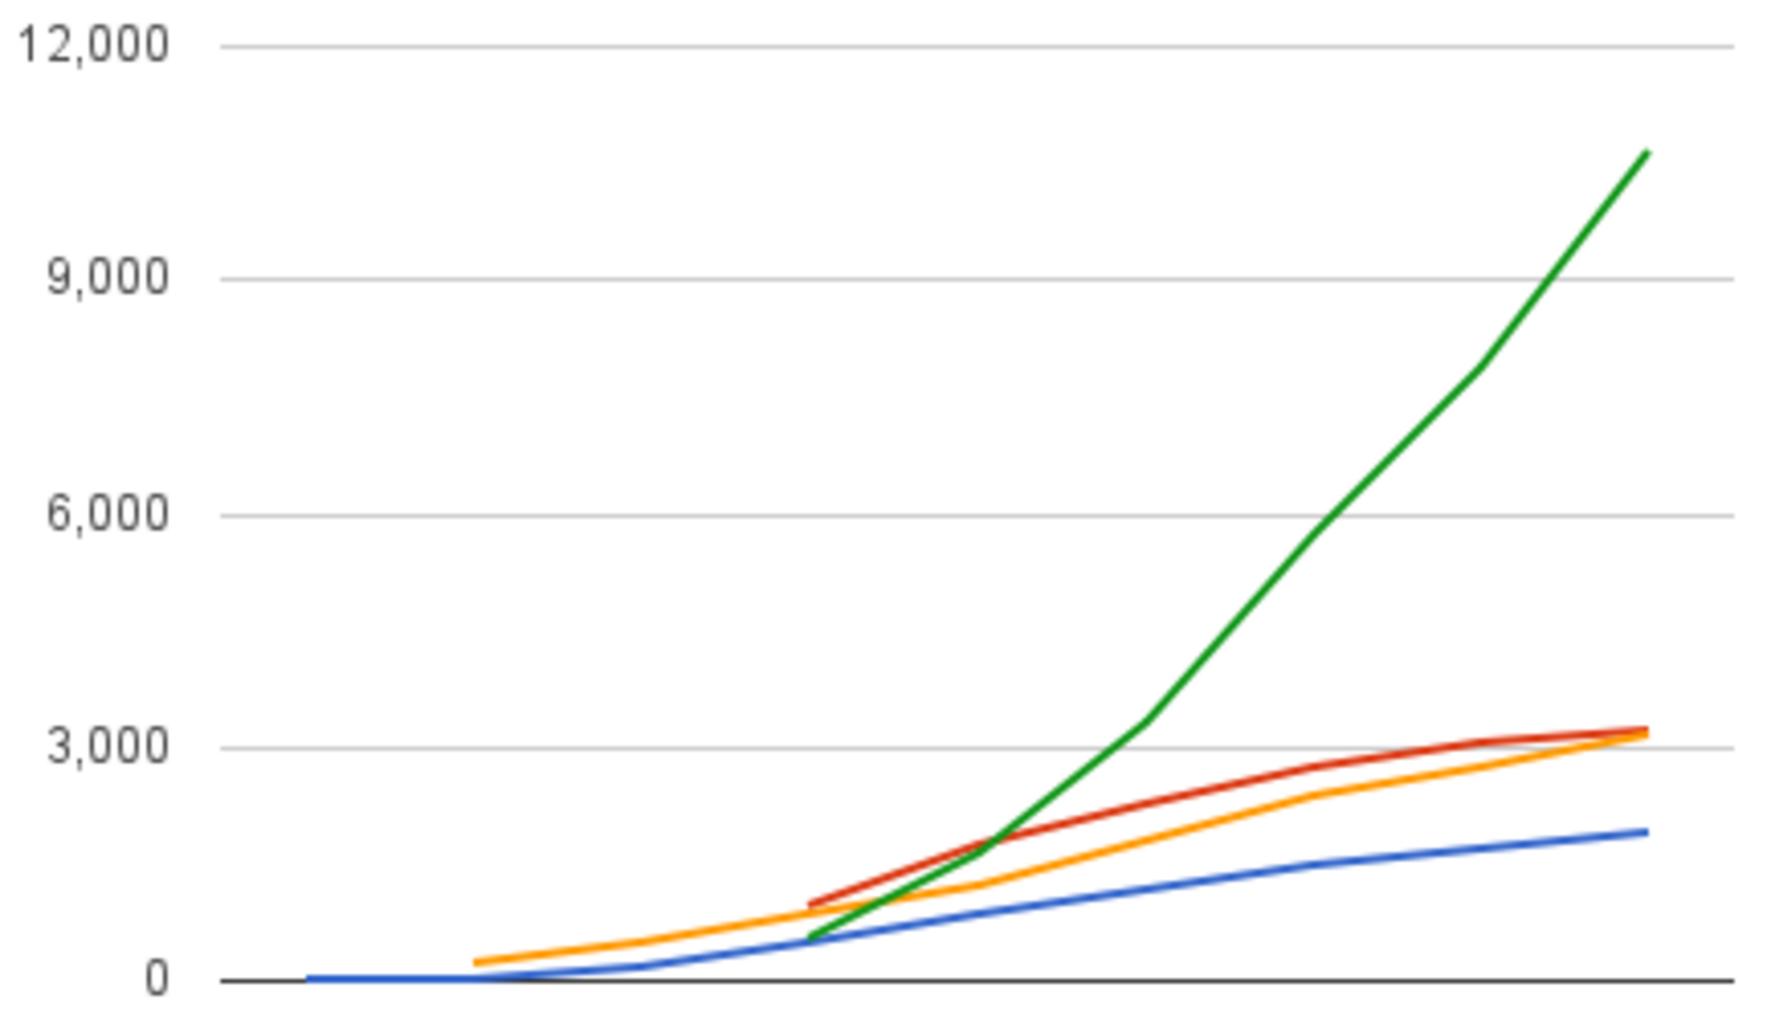
Ad Hoc Analysis, A graph of data is sometimes the outcome of ad hoc analysis.
Ad hoc means “just for a certain reason.” In business intelligence, ad hoc analysis is performed to answer a specific question at a certain time; in other words, on a “as needed” basis.
The end result is a graph, report, or another summary that aids in business decision-making.

The usage of a dashboard can help with ad hoc analysis. A dashboard gives you a quick overview of what’s going on in your chosen field.
However, there is still disagreement about the precise meaning of a Dashboard.
A dashboard, according to Stephen Few, author of three popular dashboard design books, is:
“…a visual display of the most critical information needed to achieve one or more objectives, aggregated and presented on a single screen so the data can be watched at a glance.”
The OLAP dashboard, for example, allows you to quickly access data using a point-and-click interface.
Ad Hoc Analysis becomes much more complicated when dealing with large amounts of data.
Many companies employ on-premises technologies, such as IBM’s Hadoop, or cloud services, such as Google Compute Engine, Qubole Data Service, or Microsoft Azure.
What types of statistical tests or reports are included in the process is not defined.
Ad hoc reports are typically created to fill in gaps left by regular reports or to study current reports further.
Use in Statistics and Probability
In statistics (particularly hypothesis testing), the phrase Ad Hoc Testing refers to a test that can only be utilized in very precise circumstances and for a very specific purpose.
When a researcher does an ad hoc test, it usually means they are using it in the same manner as off-brand pharmaceuticals are used.
While it may be appropriate in some circumstances, it was not developed for that purpose and should not be used in other situations.
The importance of ad hoc analysis in data culture
Ad hoc analysis, also known as ad hoc reporting, is a process for using corporate data to aid in the derivation of answers to a specific query at the time.
Typically, these are one-time inquiries. Ad hoc analysis adds a lot of flexibility and spontaneity to the traditionally strict BI reporting process.
Ad hoc analysis has become very simple for most firms thanks to the latest self-service business intelligence solutions.
These self-service business platforms combine a great user experience with sophisticated functionality that require no or very little coding.
It is better for a company if there are more people who enjoy doing number-crunching jobs.
A data-driven culture means that everyone in the company has the ability to look at their data anytime they need it and undertake ad hoc analysis.
Ad Hoc Analysis High-Level Steps
If you need to conduct an ad hoc analysis, self-service business intelligence solutions can let you do it quickly.
Although there are numerous vendors who offer BI technology, the company must follow four stages in order to do an ad hoc analysis.
- Connect various sources of data
- Self-exploration of data
- Create your own visualizations
- Develop skills
Rejection Region in Hypothesis Testing
How can you determine if your business intelligence tool can handle ad hoc analysis?
If your company is considering purchasing a business intelligence platform, it’s critical to determine whether the tool can perform ad hoc analysis.
This can be accomplished by recognizing some Bi platform properties or factors.
The self-service business intelligence platform should be implemented.
The platform must be simple to use.
Any platform evolution should take place at the platform’s core.
It’s worth noting that ad hoc analysis isn’t confined to a small group of people within an organization.
It should be viewed as a crucial component of the organization, and almost everyone in the organization should use this process to make critical decisions.


