

Algorithm Classifications in Machine Learning, There is a vast array of algorithms available in the field of machine learning that can be utilized to comprehend data.
One of two categories can be used to group these algorithms:
- Creating a model to estimate or predict an output based on one or more inputs is the first step in supervised learning algorithms.
- Unsupervised Learning Algorithms: These algorithms analyze inputs to identify patterns and relationships. There is no output that is “supervised.”
The differences between these two categories of algorithms are explained in this tutorial along with numerous examples of each.
Supervised Learning Algorithms
When we have one or more explanatory variables (X1, X2, X3,…, Xp) and a response variable (Y), and we want to create a function that defines how the explanatory variables and the response variable relate to one another:
Y = f(X) + ε
where ε is a random error term independent of X with a mean of zero, and where f is systematic information that X provides about Y.
supervised learning algorithms often fall into one of two categories:
- Regression: Continuous output variable (e.g. weight, height, time, etc.)
- Classification: The output variable has a categorical nature (e.g. male or female, pass or fail, benign or malignant, etc.)
We employ supervised learning methods for two key causes:
- Prediction:
To anticipate the value of a response variable, we frequently use a set of explanatory variables (e.g. using square footage and number of bedrooms to predict home price)
2. Inference:
We might be interested in learning how an explanatory variable’s value affects a response variable. For instance, how much does the average home price rise when the number of bedrooms increases by one?
We may employ many techniques for estimating the function f, depending on whether our objective is inference or prediction (or a combination of both).
For instance, while linear models are simpler to read, non-linear models may provide more accurate predictions.
The most popular supervised learning algorithms are listed below.
- Linear regression
- Logistic regression
- Linear discriminant analysis
- Quadratic discriminant analysis
- Decision trees
- Naive Bayes
- Support vector machines
- Neural networks
Unsupervised Learning Algorithms
When we have a list of variables (X1, X2, X3,…, Xp), we can use an unsupervised learning technique to simply search for underlying structures or patterns in the data.
Unsupervised learning algorithms typically fall into one of two categories:
- Clustering:
Using these kinds of algorithms, we try to identify “clusters” of related observations in a dataset.
This is frequently utilized in the retail industry when a business wants to find groups of customers with similar buying preferences so that it may develop targeted marketing campaigns that appeal to those groups of customers.
2. Association:
We look for “rules” that can be applied to create associations using these kinds of algorithms. Retailers might, for instance, create a rule that says, “If a customer buys product X, they are very likely to also buy product Y.”
The most popular unsupervised learning algorithms are listed below.
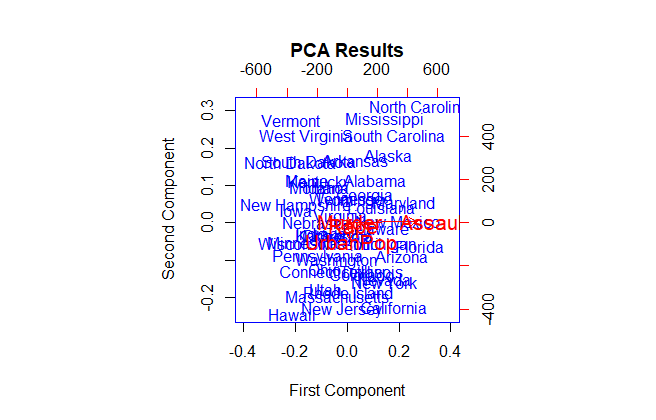
- Principal component analysis
- K-means clustering
- K-medoids clustering
- Hierarchical clustering
- Apriori algorithm
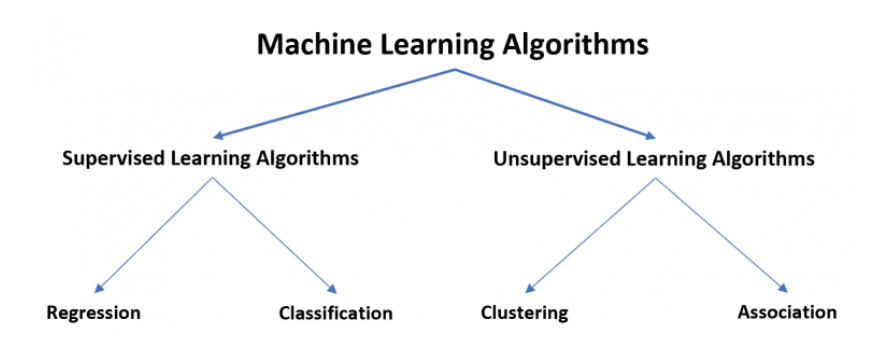
Summary
The types of machine learning algorithms are represented in the diagram below.

Further Resources:-
Because the greatest way to learn any programming language, even R, is by doing.
Random Forest Machine Learning Introduction – Data Science Tutorials
How do augmented analytics work? – Data Science Tutorials
How to Find Optimal Clusters in R? – Data Science Tutorials