Skip to content

Data Science Tutorials

For Data Science Learners

  • Home
  • R
  • Statistics
  • Course
  • Machine Learning
  • Contact
  • About Us
  • Toggle search form
  • glm function in R
    glm function in r-Generalized Linear Models R
  • Dynamic data visualizations in R
    Dynamic data visualizations in R R
  • Difference between R and Python
    Difference between R and Python R
  • ggpairs in R
    ggpairs in R R
  • Interactive 3d plot in R
    Interactive 3d plot in R-Quick Guide R
  • How to remove files and folders in R
    How to remove files and folders in R R
  • Dealing Missing values in R
    Dealing With Missing values in R R
  • How to Calculate Ratios in R
    How to Calculate Ratios in R R

Category: R

R for Data Science

How to perform a one-sample t-test in R?

Posted on May 8May 12 By Admin No Comments on How to perform a one-sample t-test in R?
How to perform a one-sample t-test in R?
Tweet
Share
Share
Pin

How to perform a one-sample t-test in R?. one-sample The t-test compares one sample’s mean to a known standard (or theoretical/hypothetical) mean. One-sample t-tests can only be used when the data is normally distributed. The Shapiro-Wilk test can be used to verify this. How to perform a one-sample t-test in R Typical research questions are:…

Read More “How to perform a one-sample t-test in R?” »

R

Test for Normal Distribution in R-Quick Guide

Posted on May 6May 12 By Admin 1 Comment on Test for Normal Distribution in R-Quick Guide
Test for Normal Distribution in R-Quick Guide
Tweet
Share
Share
Pin

Test for Normal Distribution in R, Many statistical tests, such as correlation, regression, t-test, and analysis of variance (ANOVA), presuppose that the data has particular features. They demand that the data follow a normal or Gaussian distribution. These tests are known as parametric tests since their validity is determined by the data distribution. Normality and…

Read More “Test for Normal Distribution in R-Quick Guide” »

R

glm function in r-Generalized Linear Models

Posted on May 5May 12 By Admin No Comments on glm function in r-Generalized Linear Models
glm function in r-Generalized Linear Models
Tweet
Share
Share
Pin

glm function in r, we’ll look at what generalized linear models are in R and how to make them. We’ll also go over Logistic and Poisson Regression in depth. So, let’s get this tutorial started In R, what are Generalized Linear Models? In R, generalized linear models are an extension of linear regression models that…

Read More “glm function in r-Generalized Linear Models” »

R

How to create contingency tables in R?

Posted on May 3May 12 By Admin No Comments on How to create contingency tables in R?
How to create contingency tables in R?
Tweet
Share
Share
Pin

Create contingency tables in R, Contingency tables are helpful for condensing a huge number of observations into smaller, more manageable tables. We’ll learn about contingency tables and how to make them in this R tutorial. Complex/flat tables, cross-tabulation, and recovering original data from contingency tables will all be covered. As you can see, this course…

Read More “How to create contingency tables in R?” »

R

Methods for Integrating R and Hadoop complete Guide

Posted on May 3May 12 By Admin No Comments on Methods for Integrating R and Hadoop complete Guide
Methods for Integrating R and Hadoop complete Guide
Tweet
Share
Share
Pin

In this lesson, we’ll look at how to integrate R with Hadoop. For Big Data analysis, we’ll show you a variety of R and Hadoop integration strategies. When it comes to large data, R is the go-to tool for data scientists and analysts. It may be ideal for many data science jobs, but when it…

Read More “Methods for Integrating R and Hadoop complete Guide” »

R

Detecting and Dealing with Outliers: First Step

Posted on May 1May 12 By Admin No Comments on Detecting and Dealing with Outliers: First Step
Detecting and Dealing with Outliers: First Step
Tweet
Share
Share
Pin

Detecting and Dealing with Outliers, We’re going to look a little bit more at these mammals’ sleep data. Let’s take a summary of them. library(mice) summary(mammalsleep)  species bw brw African elephant : 1 Min. : 0.005 Min. : 0.14 African giant pouched rat: 1 1st Qu.: 0.600 1st Qu.: 4.25 Arctic Fox : 1 Median…

Read More “Detecting and Dealing with Outliers: First Step” »

R

Dealing With Missing values in R

Posted on April 28April 30 By Admin No Comments on Dealing With Missing values in R
Dealing With Missing values in R
Tweet
Share
Share
Pin

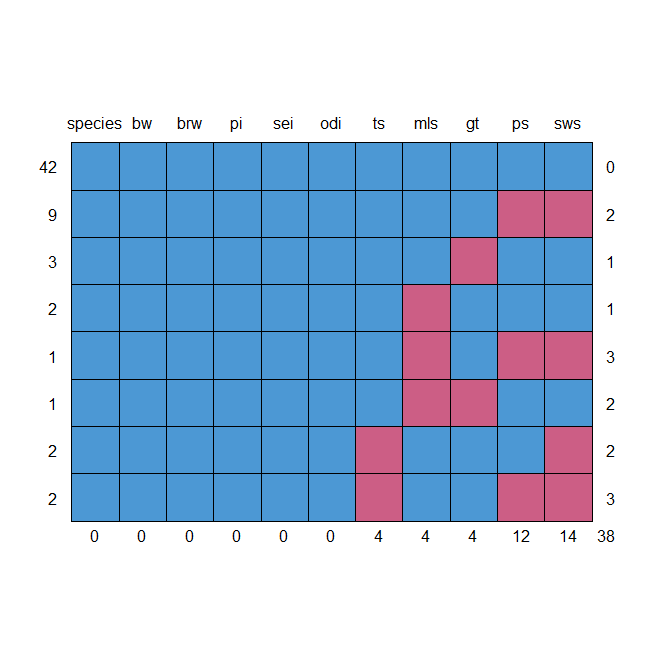
Dealing With Missing Values in R, one of the issues is that when you have a large matrix of data and some of the columns have a few missing values, it might be difficult to work with. Checking Missing Values in R – (datasciencetut.com) You won’t be able to perform a lot of multivariate or…

Read More “Dealing With Missing values in R” »

R

Checking Missing Values in R

Posted on April 27April 30 By Admin No Comments on Checking Missing Values in R
Checking Missing Values in R
Tweet
Share
Share
Pin

Checking Missing Values in R, we’ll undertake data wrangling, which is the pre-processing and preparation of data. In fact, practicing data science will consume more than 70% of your time. We’ll only look at a few of the most important commands to make things as simple as possible. However, you will devote a significant amount…

Read More “Checking Missing Values in R” »

R

Best GGPlot Themes You Should Know

Posted on April 26April 30 By Admin No Comments on Best GGPlot Themes You Should Know
Best GGPlot Themes You Should Know
Tweet
Share
Share
Pin

Best GGPlot Themes, This tutorial covers everything you need to know about the greatest ggplot2 themes, including. How to use the built-in ggplot2 themes to change the appearance of plots. How to change the appearance of plots using the ggthemes library’s predefined themes. How to change the plot panel background and gridlines, as well as…

Read More “Best GGPlot Themes You Should Know” »

R

Quantiles by Group calculation in R with examples

Posted on April 24April 30 By Admin No Comments on Quantiles by Group calculation in R with examples
Quantiles by Group calculation in R with examples
Tweet
Share
Share
Pin

Quantiles by Group calculation in R, Quantiles are numbers in statistics that divide a ranking dataset into equal groups. In R, we can use the following functions from the dplyr package to calculate quantiles grouped by a certain variable. library(dplyr) Identify the quantiles that you’re interested in. q<-c(0.25, 0.5, 0.80) Quantiles are calculated by grouping…

Read More “Quantiles by Group calculation in R with examples” »

R

Posts navigation

Previous 1 … 19 20 21 Next
  • Wrap a character string in R
  • Duplicate and concatenate in R
  • Locate position of patterns in a character string in R
  • Sort or Order Rank in R
  • Divide data into groups in R
  • About Us
  • Contact
  • Disclaimer
  • Privacy Policy

https://www.r-bloggers.com

  • YouTube
  • Twitter
  • Facebook
  • Course
  • Excel
  • Machine Learning
  • Opensesame
  • R
  • Statistics

Check your inbox or spam folder to confirm your subscription.

  • Algorithm Classifications in Machine Learning
    Algorithm Classifications in Machine Learning Machine Learning
  • How To Become a Business Intelligence Analyst
    How To Become a Business Intelligence Analyst Course
  • Top Reasons To Learn R
    Top Reasons To Learn R in 2023 Machine Learning
  • Calculating Conditional Probability in R
    Calculating Conditional Probability in R R
  • Best Books to Learn R Programming
    Best Books to Learn R Programming Course
  • How to Analyze Likert Scale Data
    How to Analyze Likert Scale Data? Statistics
  • Data Science Challenges in R Programming Language
    Data Science Challenges in R Programming Language Machine Learning
  • How to Perform Bootstrapping in R
    How to Perform Bootstrapping in R R

Privacy Policy

Copyright © 2024 Data Science Tutorials.

Powered by PressBook News WordPress theme