


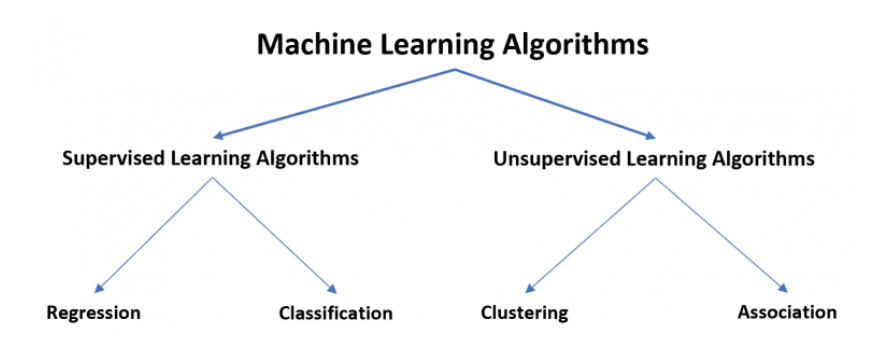
Test for Normal Distribution in R, Many statistical tests, such as correlation, regression, t-test, and analysis of variance (ANOVA), presuppose that the data has particular features.
They demand that the data follow a normal or Gaussian distribution. These tests are known as parametric tests since their validity is determined by the data distribution.
Normality and other assumptions made by these tests should be considered carefully in order to obtain meaningful results and interpretations from the research.
We should do some preliminary tests before utilizing a parametric test to ensure that the test assumptions are met.
Non-parametric tests are indicated in cases where the assumptions are violated.
We’ll go over how to check the data for normality using visual examination and significance tests.
Let’s install the dplyr package, dplyr used for data manipulation.
install.packages("dplyr")
ggpubr is a simple ggplot2-based data visualization tool.
install.packages("ggpubr")
Load required R packages
library("dplyr")
library("ggpubr")
Now we can import data into R
data <- ToothGrowth
head(data)
   len supp dose
1  4.2   VC  0.5
2 11.5   VC  0.5
3  7.3   VC  0.5
4  5.8   VC  0.5
5  6.4   VC  0.5
6 10.0   VC  0.5
We wish to see if the tooth length variable, len, is normally distributed.
dim(data)
[1] 60 3
Large sample sizes in this case. We can ignore the data distribution and utilize parametric testing if the sample size is large enough (n > 30).
The central limit theorem states that if the sample size is high enough (n > 30), the sampling distribution will tend to be normal no matter what distribution items have.
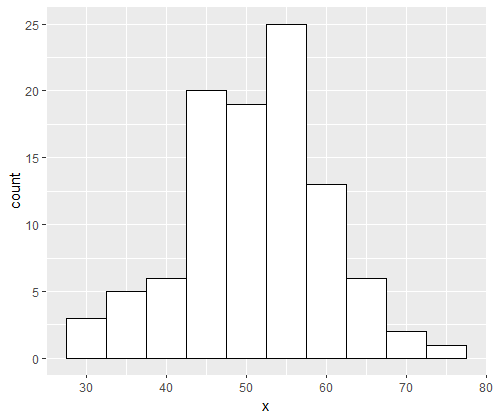
Normality can be assessed visually [normal plots (histogram), Q-Q plot (quantile-quantile plot)] or by significance tests to ensure consistency.
Visual techniques
Visual checks for normalcy include the density plot and the Q-Q plot.
The density plot is used to determine whether the distribution is bell-shaped.
library("ggpubr")
ggdensity(data$len,
          main = "Density plot",
          xlab = "Tooth length")
The Q-Q plot (also known as the quantile-quantile plot) depicts the relationship between a sample and the normal distribution. Also plotted is a 45-degree reference line.
library(ggpubr)
ggqqplot(data$len)

The function qqPlot() can also be used in the car package.
library("car")
qqPlot(data$len)
We can infer normality because all of the points lie roughly along this reference line.
Test for normality
The previous section’s description of visual inspection is frequently erroneous.
A significance test can be used to determine whether data exhibit a significant deviation from normalcy by comparing the sample distribution to a normal distribution.
The Kolmogorov-Smirnov (K-S) normality test and the Shapiro-test Wilk’s are two examples of normality tests.
“Sample distribution is normal,” is the null hypothesis in these tests. The distribution is non-normal if the test is significant.
For normality tests, Shapiro-approach Wilk’s is frequently preferred because it has more power than K-S. It is based on the data’s association with the relevant normal scores.
It’s worth noting that the normalcy test is affected by sample size. The majority of small samples pass normalcy testing.
In order to make the best decision, it’s crucial to combine visual assessment and significance testing.
The Shapiro-Wilk test of normality for one variable (univariate) can be performed with the R function shapiro.test().
Methods for Integrating R and Hadoop complete Guide
shapiro.test(data$len)
Shapiro-Wilk normality test
data:  data$len
W = 0.96743, p-value = 0.1091
Conclusion
The p-value > 0.05 in the output indicates that the data distribution is not substantially different from the normal distribution. To put it another way, we can assume normality.


Are there any way to count the points outside the confidence envelope?