Skip to content

Data Science Tutorials

For Data Science Learners

  • Home
  • R
  • Statistics
  • Course
  • Machine Learning
  • Contact
  • About Us
  • Toggle search form
  • Data Scientist in 2023
    How to Become a Data Scientist in 2023 Machine Learning
  • Top 10 Data Visualisation Tools
    Top 10 Data Visualisation Tools Every Data Science Enthusiast Must Know Course
  • how to draw heatmap in r
    How to draw heatmap in r: Quick and Easy way R
  • Lottery Prediction Using Machine Learning
    Lottery Prediction Using Machine Learning Machine Learning
  • Control Chart in Quality Control
    Control Chart in Quality Control-Quick Guide Statistics
  • Separate a data frame column into multiple columns
    Separate a data frame column into multiple columns-tidyr Part3 R
  • computational gastronomy for data science
    Computational Gastronomy for Data Science Machine Learning
  • How to Find Correlation Coefficient p value in R
    How to Find Correlation Coefficient p value in R R

Category: R

R for Data Science

Group By Minimum in R

Posted on February 6February 6 By Admin No Comments on Group By Minimum in R
Group By Minimum in R

Group By Minimum in R, the GROUP BY clause is used in combination with aggregate functions such as MIN(), MAX(), SUM() etc. to group rows that have the same value or similar values into summary rows. This allows you to perform calculations on the grouped data instead of on the entire dataset. The GROUP BY…

Read More “Group By Minimum in R” »

R

Group By Maximum in R

Posted on February 1February 1 By Admin No Comments on Group By Maximum in R
Group By Maximum in R

Group by Mzximum In R programming, the group_by() function is used to group data based on one or more variables. The max() function, on the other hand, returns the maximum value in a vector or array. In this article, we will learn how to use the group_by() and max() functions together in R to find…

Read More “Group By Maximum in R” »

R

How to deal with text in R

Posted on January 21January 21 By Admin No Comments on How to deal with text in R
How to deal with text in R

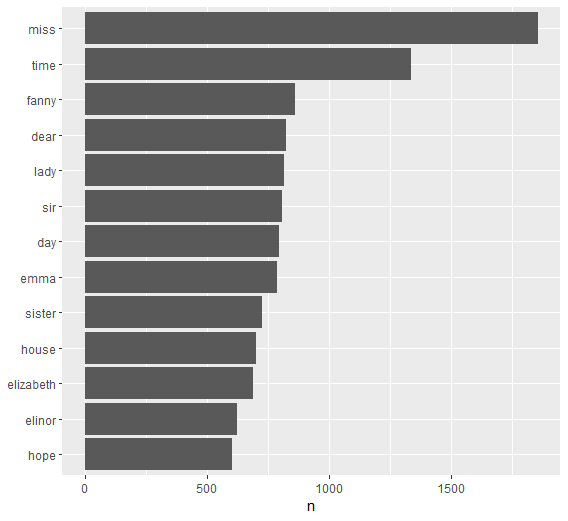
How to deal with text in R, It is possible to handle data more efficiently and effectively by adhering to tidy data standards, and processing text is no exception. According to Hadley Wickham’s description (Wickham 2014), tidy data follows a particular structure: Thus, a table with one token per row is our definition of the…

Read More “How to deal with text in R” »

R

Bootstrapping in R

Posted on January 16January 16 By Admin No Comments on Bootstrapping in R
Bootstrapping in R

Bootstrapping in R, Inferential statistics employs a technique called bootstrapping that builds random samples of single datasets repeatedly. Calculating sampling metrics like mean, median, mode, confidence intervals, etc. is made possible by bootstrapping. Bootstrapping in R The steps involved in bootstrapping using the R programming language are as follows: The future of Data Science: Predictions…

Read More “Bootstrapping in R” »

R

Hypothesis Testing in R Programming

Posted on January 10January 10 By Admin No Comments on Hypothesis Testing in R Programming
Hypothesis Testing in R Programming

Hypothesis Testing in R Programming, Hypothesis testing is a statistical method used to determine whether the observed data supports a specific hypothesis or not. In R programming, there are both parametric and non-parametric methods for hypothesis testing. Parametric methods assume that the data follows a specific distribution, such as normal distribution, while non-parametric methods do…

Read More “Hypothesis Testing in R Programming” »

R

How to Find Correlation Coefficient p value in R

Posted on January 4January 4 By Admin No Comments on How to Find Correlation Coefficient p value in R
How to Find Correlation Coefficient p value in R

How to Find Correlation Coefficient p value in R, linear relationship between two variables can be quantified using the Pearson correlation coefficient. The value of this correlation coefficient is always between -1 and 1, where: -1: A linear correlation between two variables that is perfectly negative0: The pair of variables do not correlate linearly.+1: The…

Read More “How to Find Correlation Coefficient p value in R” »

R

Stacked Barplot in R

Posted on December 20December 20 By Admin No Comments on Stacked Barplot in R
Stacked Barplot in R

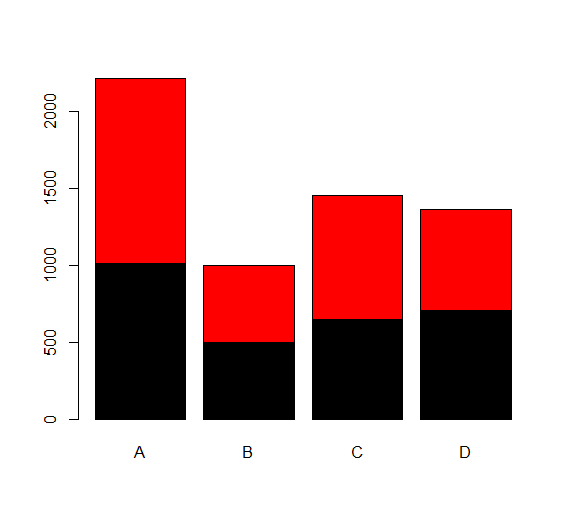
Stacked Barplot in R, A stacked bar chart is a type of bar chart that looks at two categorical variables instead of just one when examining numerical data. A stacked barplot is a type of chart used to display the composition of a whole or total value in terms of its parts. It is created…

Read More “Stacked Barplot in R” »

R

How to create summary table in R

Posted on December 19December 19 By Admin No Comments on How to create summary table in R
How to create summary table in R

How to create summary table in R, Using the describe() and describeBy() methods from the psych library is the most straightforward method for creating summary tables in R. How to create summary table in R To create summary tables in R using the `psych` library, you can follow these steps: 1. Basic Summary Table: library(psych)…

Read More “How to create summary table in R” »

R

How to copy files in R

Posted on December 9December 9 By Admin No Comments on How to copy files in R
How to copy files in R

How to copy files in R, copying files is a common task that you may need to perform while working with data. Whether you’re moving files between directories, creating backup copies, or sharing data with others, R provides several functions to help you efficiently copy files. In this tutorial, we’ll explore how to copy files…

Read More “How to copy files in R” »

R

How to Change X-Axis Labels of Barplot In R

Posted on December 3December 3 By Admin No Comments on How to Change X-Axis Labels of Barplot In R
How to Change X-Axis Labels of Barplot In R

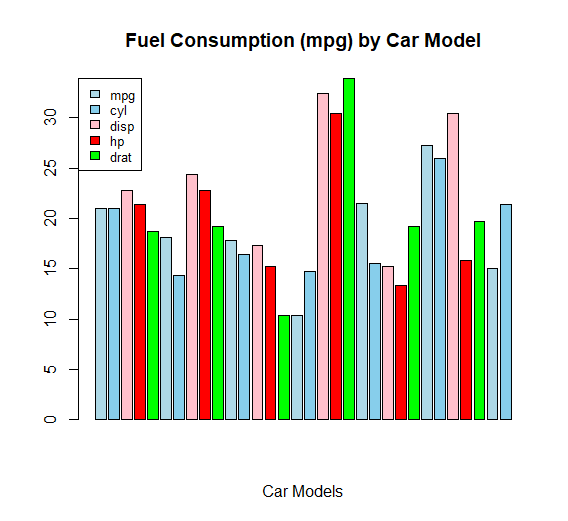
How to Change X-Axis Labels of Barplot In R programming language, the barplot() function is used to create vertical bar charts or histograms. It is a part of the base R package and stands for “bar plot”. By default, R assigns the names of the variables as the x-axis labels in a barplot(). However, sometimes…

Read More “How to Change X-Axis Labels of Barplot In R” »

R

Posts navigation

Previous 1 … 3 4 5 … 22 Next
  • Descriptive Statistics in R
  • Multiple Plots to PDF in R
  • Run a specific code block in R
  • Replace first match in R
  • Display the structure in R
  • About Us
  • Contact
  • Disclaimer
  • Privacy Policy

https://www.r-bloggers.com

  • YouTube
  • Twitter
  • Facebook
  • Course
  • Excel
  • Machine Learning
  • Opensesame
  • R
  • Statistics

Check your inbox or spam folder to confirm your subscription.

  • Check whether any values of a logical vector are TRUE
    Check whether any values of a logical vector are TRUE R
  • Cross-validation in Machine Learning
    Cross-validation in Machine Learning Statistics
  • How to create summary table in R
    How to create summary table in R R
  • Steps to Mastering Natural Language Processing
    Steps to Mastering Natural Language Processing Machine Learning
  • Boosting in Machine Learning
    Boosting in Machine Learning:-A Brief Overview Machine Learning
  • Extract certain rows of data set in R R
  • A Side-by-Side Boxplot in R
    A Side-by-Side Boxplot in R: How to Do It R
  • What is the best way to filter by row number in R?
    What is the best way to filter by row number in R? R

Privacy Policy

Copyright © 2024 Data Science Tutorials.

Powered by PressBook News WordPress theme