Skip to content

Data Science Tutorials

For Data Science Learners

  • Bind together two data frames by their rows or columns in R
    Bind together two data frames by their rows or columns in R R
  • learn Hadoop for Data Science
    Learn Hadoop for Data Science Machine Learning
  • 5 Free Books to Learn Statistics For Data Science
    5 Free Books to Learn Statistics For Data Science Course
  • In data science, what Is Open Innovation?
    In data science, what Is Open Innovation? R
  • ChatGPT Coursera Review
    ChatGPT Coursera Review Course
  • Gamma distribution in R
    Gamma distribution in R R
  • Jarque-Bera Test in R
    Jarque-Bera Test in R With Examples R
  • Extract certain rows of data set in R R
Triangular Distribution in R

Triangular Distribution in R

Posted on September 23September 23 By Admin No Comments on Triangular Distribution in R

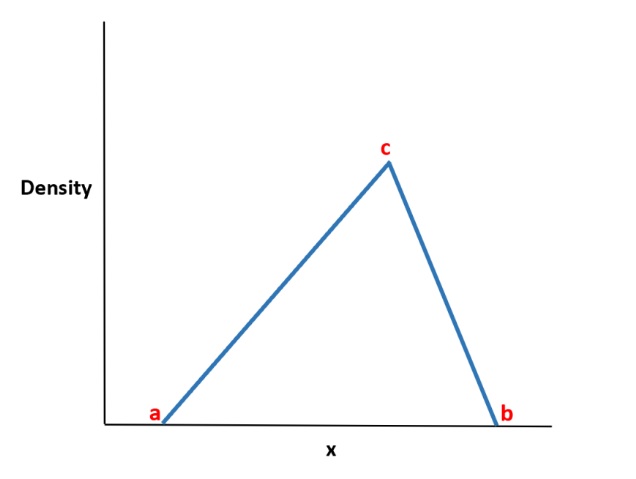
Triangular Distribution in R, A continuous probability distribution with a triangle-shaped probability density function is known as the triangular distribution.

The following three values describe it:

  • The bare minimum of a
  • The highest value b
  • The maximum value c

Triangular Distribution in R

To calculate probabilities for the triangular distribution in R, use the ptri() function from the EnvStats package. Its syntax is as follows.

ptri(q, min = 0, max = 1, mode = 1/2)

where:

q: Quantile of interest

min: The distribution’s smallest possible value

max: The distribution’s top value at its maximum

mode: The distribution’s highest point

The examples that follow demonstrate how to actually utilize this function in R.

Example 1:- Calculating the Probability Less Than Some Value

Consider a restaurant that anticipates a minimum $20,000, a maximum $40,000, and most likely $35,000 in total revenues for the forthcoming week.

What is the chance that the restaurant’s overall sales would be less than $30,000?

To determine this probability, we can use the code below:

library(EnvStats)

Let’s calculate the probability

ptri(q = 30000, min = 20000, max = 40000, mode = 35000)
[1] 0.3333333

The likelihood that the restaurant’s total sales fall below $30,000 is.333.

Example 2:-Calculating Probability Greater Than Some Value

Let’s say a store predicts that in any given week, there would be a minimum of 600, a maximum of 3,000, and a likelihood of 2,200 customers.

What is the likelihood that the store will receive more than 2,500 visitors in a given week?

1 - ptri(q = 2500, min = 600, max = 3000, mode = 2200)
[1] 0.1302083

About 0.1302083 percent of customers over 2,500 will enter the store.

Check your inbox or spam folder to confirm your subscription.

Further Resources:-
The following tutorials provide guidance on using R to manipulate various probability distributions:

The Multinomial Distribution in R – Data Science Tutorials

The Uniform Distribution in R – Data Science Tutorials

Test for Normal Distribution in R-Quick Guide – Data Science Tutorials

R

Post navigation

Previous Post: The Multinomial Distribution in R
Next Post: Gamma distribution in R

Related Posts

  • How to apply a transformation to multiple columns in R?
    How to apply a transformation to multiple columns in R? R
  • How to Calculate Relative Frequencies in R
    How to Calculate Relative Frequencies in R? R
  • ggdogs on ggplot2
    ggdogs on ggplot2 R
  • Tips for Rearranging Columns in R
    Tips for Rearranging Columns in R R
  • How to Replace Inf Values with NA in R
    How to Replace Inf Values with NA in R R
  • R-Change Number of Bins in Histogram R

Leave a Reply Cancel reply

Your email address will not be published. Required fields are marked *

  • Best Prompt Engineering Books
  • Understanding Machine Learning and Data Science
  • Best Git Books
  • Top 5 Books to Learn Data Engineering
  • Mastering R Programming for Data Science: Tips and Tricks
  • About Us
  • Contact
  • Disclaimer
  • Privacy Policy

https://www.r-bloggers.com

  • YouTube
  • Twitter
  • Facebook
  • Course
  • Excel
  • Machine Learning
  • Opensesame
  • R
  • Statistics

Check your inbox or spam folder to confirm your subscription.

  • How to Use Bold Font in
    How to Use Bold Font in R with Examples R
  • Comparing group means in R
    One way ANOVA Example in R-Quick Guide R
  • Adding Subtitles in ggplot2 R
  • Solving Systems of Equations in R R
  • Export output as text in R R
  • Convert multiple columns into a single column
    Convert multiple columns into a single column-tidyr Part4 R
  • similarity measure between two populations
    Similarity Measure Between Two Populations-Brunner Munzel Test Statistics
  • How to create contingency tables in R
    How to create contingency tables in R? R

Privacy Policy

Copyright © 2025 Data Science Tutorials.

Powered by PressBook News WordPress theme