Skip to content

Data Science Tutorials

For Data Science Learners

  • Home
  • R
  • Statistics
  • Course
  • Machine Learning
  • Contact
  • About Us
  • Toggle search form
  • Triangular Distribution in R
    Triangular Distribution in R R
  • How to Use Gather Function in R
    How to Use Gather Function in R?-tidyr Part2 R
  • Data Analytics Online Courses for Beginners
    Data Analytics Online Courses for Beginners Course
  • Calculating Autocorrelation in R R
  • How to Compare Two Lists in Excel Using VLOOKUP
    How to Compare Two Lists in Excel Using VLOOKUP Excel
  • Interactive 3d plot in R
    Interactive 3d plot in R-Quick Guide R
  • How to add Axes to Plot in R R
  • computational gastronomy for data science
    Computational Gastronomy for Data Science Machine Learning

Detecting and Dealing with Outliers: First Step

Posted on May 1May 12 By Admin No Comments on Detecting and Dealing with Outliers: First Step
Detecting and Dealing with Outliers: First Step

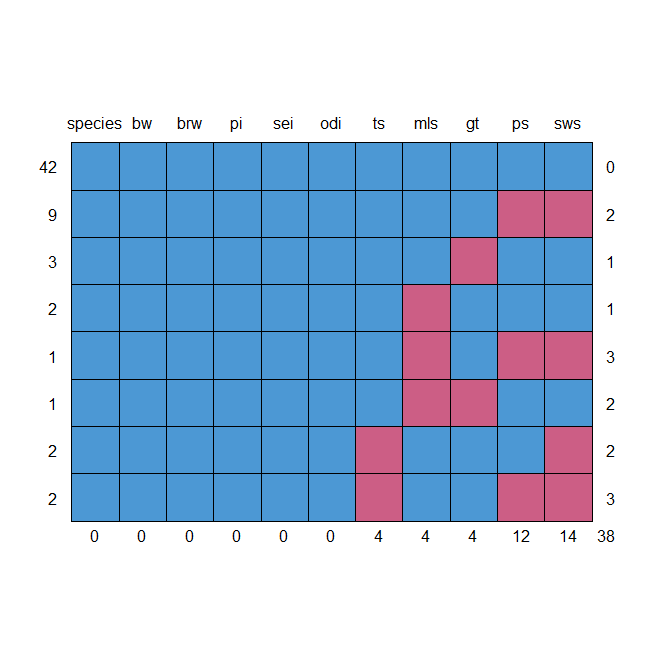
Detecting and Dealing with Outliers, We’re going to look a little bit more at these mammals’ sleep data. Let’s take a summary of them. library(mice) summary(mammalsleep)  species bw brw African elephant : 1 Min. : 0.005 Min. : 0.14 African giant pouched rat: 1 1st Qu.: 0.600 1st Qu.: 4.25 Arctic Fox : 1 Median…

Read More “Detecting and Dealing with Outliers: First Step” »

R

Dealing With Missing values in R

Posted on April 28April 30 By Admin No Comments on Dealing With Missing values in R
Dealing With Missing values in R

Dealing With Missing Values in R, one of the issues is that when you have a large matrix of data and some of the columns have a few missing values, it might be difficult to work with. Checking Missing Values in R – (datasciencetut.com) You won’t be able to perform a lot of multivariate or…

Read More “Dealing With Missing values in R” »

R

Checking Missing Values in R

Posted on April 27April 30 By Admin No Comments on Checking Missing Values in R
Checking Missing Values in R

Checking Missing Values in R, we’ll undertake data wrangling, which is the pre-processing and preparation of data. In fact, practicing data science will consume more than 70% of your time. We’ll only look at a few of the most important commands to make things as simple as possible. However, you will devote a significant amount…

Read More “Checking Missing Values in R” »

R

Best GGPlot Themes You Should Know

Posted on April 26April 30 By Admin No Comments on Best GGPlot Themes You Should Know
Best GGPlot Themes You Should Know

Best GGPlot Themes, This tutorial covers everything you need to know about the greatest ggplot2 themes, including. How to use the built-in ggplot2 themes to change the appearance of plots. How to change the appearance of plots using the ggthemes library’s predefined themes. How to change the plot panel background and gridlines, as well as…

Read More “Best GGPlot Themes You Should Know” »

R

Descriptive statistics vs Inferential statistics: Guide

Posted on April 25April 30 By Admin No Comments on Descriptive statistics vs Inferential statistics: Guide
Descriptive statistics vs Inferential statistics: Guide

Descriptive statistics vs Inferential statistics: In the field of statistics, there are two primary branches, Descriptive Statistics Inferential Statistics Descriptive statistics vs Inferential statistics The differences between the two branches are explained in this tutorial, as well as why each is helpful in certain scenarios. Descriptive Statistics In a word, descriptive statistics seeks to use…

Read More “Descriptive statistics vs Inferential statistics: Guide” »

Statistics

Quantiles by Group calculation in R with examples

Posted on April 24April 30 By Admin No Comments on Quantiles by Group calculation in R with examples
Quantiles by Group calculation in R with examples

Quantiles by Group calculation in R, Quantiles are numbers in statistics that divide a ranking dataset into equal groups. In R, we can use the following functions from the dplyr package to calculate quantiles grouped by a certain variable. library(dplyr) Identify the quantiles that you’re interested in. q<-c(0.25, 0.5, 0.80) Quantiles are calculated by grouping…

Read More “Quantiles by Group calculation in R with examples” »

R

How to Use the Multinomial Distribution in R?

Posted on April 23April 30 By Admin 5 Comments on How to Use the Multinomial Distribution in R?
How to Use the Multinomial Distribution in R?

Multinomial Distribution in R, when each result has a given probability of occurring, the multinomial distribution describes the likelihood of obtaining a specific number of counts for k different outcomes. A statistical experiment with n repeated trials is known as a multinomial experiment. There are a finite number of possible outcomes in each trial. The…

Read More “How to Use the Multinomial Distribution in R?” »

R

Get the first value in each group in R?

Posted on April 23April 30 By Admin No Comments on Get the first value in each group in R?
Get the first value in each group in R?

Get the first value in each group in R, Knowing the first, last, or nth value in the group can be important at times. With the help of various examples, we will look at how to retrieve the initial value for each group in this article. The aggregate() or group by() functions in R can…

Read More “Get the first value in each group in R?” »

R

Control Chart in Quality Control-Quick Guide

Posted on April 23April 30 By Admin No Comments on Control Chart in Quality Control-Quick Guide
Control Chart in Quality Control-Quick Guide

Control chart in quality control, To analyze the product’s quality, a statistical Quality Control chart is employed. Every product is created for a certain purpose; if it accomplishes that aim perfectly, it is deemed high quality; if not, it is not. For example, It is of good quality if an article meets the criteria; otherwise,…

Read More “Control Chart in Quality Control-Quick Guide” »

Statistics

How to get the last value of each group in R

Posted on April 23April 30 By Admin No Comments on How to get the last value of each group in R
How to get the last value of each group in R

How to get the last value of each group in r, the aggregate() or group by() functions in R can be used to get the last value of each group. Let’s have a look at how to? Obtain the most recent value for each group – group by a single column. Get each group’s most…

Read More “How to get the last value of each group in R” »

R

Posts navigation

Previous 1 … 27 28 29 Next
  • Multiple regression model in R
  • Descriptive statistics in R
  • How to Find the Size of a Data Frame in R
  • Filter a Vector in R
  • Split a Vector into Chunks in R
  • About Us
  • Contact
  • Disclaimer
  • Privacy Policy

https://www.r-bloggers.com

  • YouTube
  • Twitter
  • Facebook
  • Course
  • Excel
  • Machine Learning
  • Opensesame
  • R
  • Statistics

Check your inbox or spam folder to confirm your subscription.

  • 5 Free Books to Learn Statistics For Data Science
    5 Free Books to Learn Statistics For Data Science Course
  • Arrange Data by Month in R
    Arrange Data by Month in R with example R
  • How to move from Junior Data Scientist
    How to move from Junior Data Scientist Machine Learning
  • How to Display Percentages on Histogram IN R
    How to Display Percentages on Histogram in R R
  • OLS Regression in R
    OLS Regression in R R
  • Load Multiple Packages in R
    Load Multiple Packages in R R
  • Boosting in Machine Learning
    Boosting in Machine Learning:-A Brief Overview Machine Learning
  • Credit Card Fraud detection in R
    Credit Card Fraud Detection in R R

Privacy Policy

Copyright © 2024 Data Science Tutorials.

Powered by PressBook News WordPress theme