Skip to content

Data Science Tutorials

For Data Science Learners

  • AI in Delivery Management
    AI in Delivery Management Machine Learning
  • How to choose optimal number of epochs in R
    How to choose optimal number of epochs in R Machine Learning
  • Check whether any values of a logical vector are TRUE
    Check whether any values of a logical vector are TRUE R
  • glm function in R
    glm function in r-Generalized Linear Models R
  • Linear Interpolation in R
    Linear Interpolation in R-approx R
  • Locate position of patterns in a character string in R R
  • Understanding Machine Learning and Data Science R
  • How to change the column positions in R?
    How to change the column positions in R? R

Tag: ggplot2

How to Add a caption to ggplot2 Plots in R?

Posted on September 1September 1 By Admin No Comments on How to Add a caption to ggplot2 Plots in R?
How to Add a caption to ggplot2 Plots in R?

How to Add a caption to ggplot2 Plots in R?, the graphs in ggplot2 can have captions added using one of the methods listed below. With the following data frame in R, the following examples demonstrate how to use each technique in practice. A Side-by-Side Boxplot in R: How to Do It – Data Science…

Read More “How to Add a caption to ggplot2 Plots in R?” »

R

A Side-by-Side Boxplot in R: How to Do It

Posted on July 16July 15 By Admin No Comments on A Side-by-Side Boxplot in R: How to Do It
A Side-by-Side Boxplot in R: How to Do It

A Side-by-Side Boxplot in R, when a data point or dataset is displayed as a graph, such as a vertical or horizontal boxplot, rather than as a list of numbers, it is frequently much simpler to spot patterns in the data. There are many distinct kinds of graphs, and each one can display various kinds…

Read More “A Side-by-Side Boxplot in R: How to Do It” »

R

Change ggplot2 Theme Color in R ggthemr Package

Posted on May 15May 15 By Admin No Comments on Change ggplot2 Theme Color in R ggthemr Package
Change ggplot2 Theme Color in R ggthemr Package

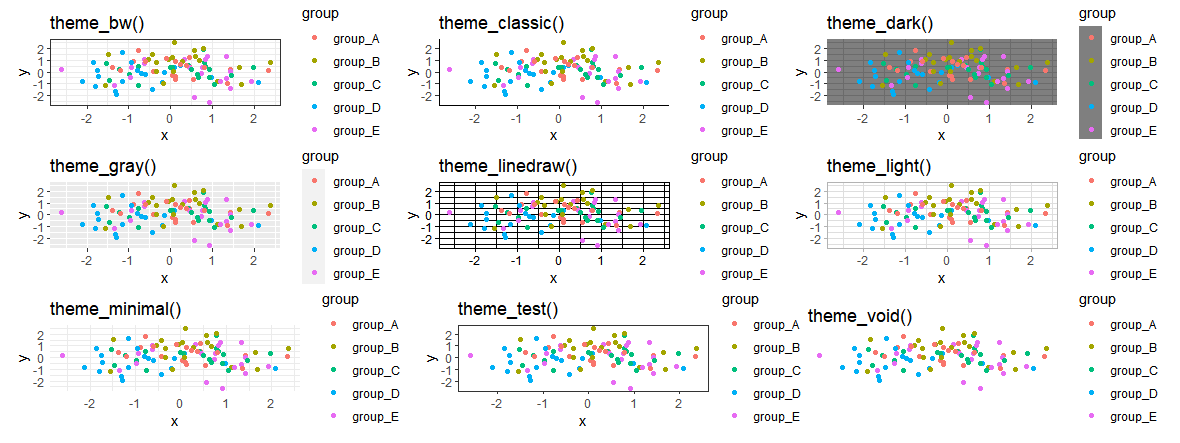
 In this article, you’ll learn how to change the colors of ggplot2 visuals in the R programming language by utilizing different themes. Let’s start by making some sample data in R. set.seed(123)                             df <- data.frame(x = rnorm(100),                    y = rnorm(100),                    group = paste0(“group_”, LETTERS[1:5])) head(df)                                       x          y   group 1  0.7842588 -0.3663221 group_A 2 …

Read More “Change ggplot2 Theme Color in R ggthemr Package” »

R
  • Maximizing Model Accuracy with Train-Test Splits in Machine Learning
  • Type II Errors in R
  • Best Prompt Engineering Books
  • Understanding Machine Learning and Data Science
  • Best Git Books
  • About Us
  • Contact
  • Disclaimer
  • Privacy Policy

https://www.r-bloggers.com

  • YouTube
  • Twitter
  • Facebook
  • Course
  • Excel
  • Machine Learning
  • Opensesame
  • R
  • Statistics

Check your inbox or spam folder to confirm your subscription.

  • ChatGPT Coursera Review
    ChatGPT Coursera Review Course
  • Top 7 Skills Required to Become a Data Scientist
    Top 7 Skills Required to Become a Data Scientist Machine Learning
  • The Multinomial Distribution in R
    The Multinomial Distribution in R R
  • How to deal with text in R
    How to deal with text in R R
  • Statistical test assumptions and requirements
    Statistical test assumptions and requirements Statistics
  • Sort Data in R With Examples
    Sort Data in R With Examples R
  • How to Use Mutate function in R
    How to Use Mutate function in R R
  • Bind together two data frames by their rows or columns in R
    Bind together two data frames by their rows or columns in R R

Privacy Policy

Copyright © 2025 Data Science Tutorials.

Powered by PressBook News WordPress theme