Skip to content

Data Science Tutorials

For Data Science Learners

  • optim Function in R R
  • How to check regression analysis heteroscedasticity in R
    How to check regression analysis heteroscedasticity in R R
  • How to create a heatmap in R
    How to create a heatmap in R R
  • Comparing group means in R
    One way ANOVA Example in R-Quick Guide R
  • Check whether any values of a logical vector are TRUE
    Check whether any values of a logical vector are TRUE R
  • display the last value of each line in ggplot
    How to add labels at the end of each line in ggplot2? R
  • Hypothesis Testing in R Programming
    Hypothesis Testing in R Programming R
  • Confidence Intervals in R
    Confidence Intervals in R R

How to Specify Histogram Breaks in R

Posted on September 4September 4 By Admin No Comments on How to Specify Histogram Breaks in R

How to Specify Histogram Breaks in R, you may want to specify the number of breaks or bins to use.

How to Specify Histogram Breaks in R

By default, the hist() function uses Sturges’ Rule to determine the optimal number of bins based on the number of observations in the dataset.

However, you can override this default behavior by specifying the breaks argument.

Sturges’ Rule

Sturges’ Rule is a formula that calculates the optimal number of bins to use in a histogram based on the number of observations in the dataset. The formula is:

Optimal Bins = ⌈log2n + 1⌉

where n is the total number of observations in the dataset.

For example, if you have a dataset with 31 observations, Sturges’ Rule would suggest using 6 bins.

Add Footnote to ggplot2 » Data Science Tutorials

Specifying Breaks

If you want to specify a different number of bins to use, you can use the breaks argument in the hist() function.

However, note that R will only use this as a suggestion and may choose to use a different number of bins if it deems it necessary.

To force R to use a specific number of bins, you can use the following code:

hist(data, breaks = seq(min(data), max(data), length.out = n+1))

Where n is the desired number of bins.

Example

Suppose we have a dataset with 16 values:

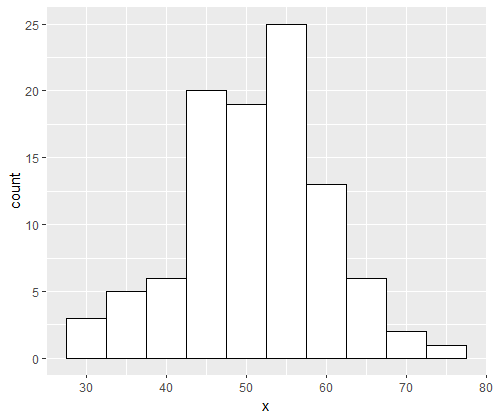
data <- c(2, 3, 3, 3, 4, 4, 5, 6, 8, 10, 12, 14, 15, 18, 20, 21)

If we use the hist() function without specifying any breaks, R will create a histogram with 5 bins:

hist(data)

However, if we try to specify 7 bins using the breaks argument, R will only take this as a suggestion and may choose to use a different number of bins:

hist(data, breaks=7)

To force R to use 7 bins, we can use the following code:

hist(data, breaks = seq(min(data), max(data), length.out = 8))

This will create a histogram with 7 equally-spaced bins.

Conclusion

While Sturges’ Rule is a useful default behavior for determining the optimal number of bins to use in a histogram, you may need to specify custom breaks depending on your specific dataset and visualization goals.

  • Introduction to the five number summary: definition, formulas, and examples
  • Effect Sizes for T-Test and ANOVA
  • Introduction to Deep Learning
  • Regression Analysis
  • Business leader’s approach towards Data Science
  • Boost Your Resume with Machine Learning Portfolio Projects
  • 10 Data analytics Interview Questions and Answer
  • Repeated Measures of ANOVA in R Complete Tutorial
R

Post navigation

Previous Post: Creating a Histogram of Two Variables in R
Next Post: R-Change Number of Bins in Histogram

Related Posts

  • How to Display Percentages on Histogram IN R
    How to Display Percentages on Histogram in R R
  • How to Visualize PCA Results in R
    How to Visualize PCA Results in R R
  • glm function in R
    glm function in r-Generalized Linear Models R
  • Group By Maximum in R
    Group By Maximum in R R
  • Two-Way ANOVA Example in R
    How to perform One-Sample Wilcoxon Signed Rank Test in R? R
  • How to convert characters from upper to lower case in R
    How to convert characters from upper to lower case in R? R

Leave a Reply Cancel reply

Your email address will not be published. Required fields are marked *

  • Best Prompt Engineering Books
  • Understanding Machine Learning and Data Science
  • Best Git Books
  • Top 5 Books to Learn Data Engineering
  • Mastering R Programming for Data Science: Tips and Tricks
  • About Us
  • Contact
  • Disclaimer
  • Privacy Policy

https://www.r-bloggers.com

  • YouTube
  • Twitter
  • Facebook
  • Course
  • Excel
  • Machine Learning
  • Opensesame
  • R
  • Statistics

Check your inbox or spam folder to confirm your subscription.

  • Bind together two data frames by their rows or columns in R
    Bind together two data frames by their rows or columns in R R
  • best books about data analytics
    Best Books to Learn Statistics for Data Science Course
  • Extract values from vector in R: dplyr R
  • Error in sum(List) : invalid 'type' (list) of argument
    Error in sum(List) : invalid ‘type’ (list) of argument R
  • Normal distribution in R
    Normal Distribution in R R
  • How to Find Unmatched Records in R
    How to Find Unmatched Records in R R
  • How to Avoid Overfitting
    How to Avoid Overfitting? Machine Learning
  • Best Books on Data Science with Python
    Best Books on Data Science with Python Course

Privacy Policy

Copyright © 2025 Data Science Tutorials.

Powered by PressBook News WordPress theme