Skip to content

Data Science Tutorials

For Data Science Learners

  • Home
  • R
  • Statistics
  • Course
  • Machine Learning
  • Contact
  • About Us
  • Toggle search form
  • How to Use the Multinomial Distribution in R
    How to Use the Multinomial Distribution in R? R
  • How to Use Spread Function in R
    How to Use Spread Function in R?-tidyr Part1 R
  • Apply central limit throem in r
    Apply Central Limit Theorem in R R
  • How to Perform Bootstrapping in R
    How to Perform Bootstrapping in R R
  • 5 Free Books to Learn Statistics For Data Science
    5 Free Books to Learn Statistics For Data Science Course
  • Artificial Intelligence Examples
    Artificial Intelligence Examples-Quick View Course
  • How to compare the performance of different algorithms in R
    How to compare the performance of different algorithms in R? R
  • Best online course for R programming
    Best online course for R programming Course

Category: R

R for Data Science

How to compare variances in R

Posted on May 29May 29 By Admin No Comments on How to compare variances in R
How to compare variances in R

How to compare variances in R?, The F-test is used to see if two populations (A and B) have the same variances. When should the F-test be used? A comparison of two variations is useful in a variety of situations, including: When you wish to examine if the variances of two samples are equal, you…

Read More “How to compare variances in R” »

R

Two Sample Proportions test in R-Complete Guide

Posted on May 28May 27 By Admin No Comments on Two Sample Proportions test in R-Complete Guide
Two Sample Proportions test in R-Complete Guide

Two Sample Proportions test in R, To compare two observed proportions, the two-proportions z-test is utilized. This article explains the fundamentals of the two-proportions *z-test and gives practical examples using R software. We have two groups of people, for example: Best GGPlot Themes You Should Know – Data Science Tutorials n = 500 in Group…

Read More “Two Sample Proportions test in R-Complete Guide” »

R

Calculate the P-Value from Chi-Square Statistic in R

Posted on May 27May 27 By Admin No Comments on Calculate the P-Value from Chi-Square Statistic in R
Calculate the P-Value from Chi-Square Statistic in R

Calculate the P-Value from Chi-Square Statistic in R, You’ll get a Chi-Square test statistic every time you run a Chi-Square test. The p-value associated with this test statistic can then be used to assess if the test findings are statistically significant. Calculate the p-Value from Z-Score in R – Data Science Tutorials The pchisq() function…

Read More “Calculate the P-Value from Chi-Square Statistic in R” »

R

Calculate the p-Value from Z-Score in R

Posted on May 27May 27 By Admin No Comments on Calculate the p-Value from Z-Score in R
Calculate the p-Value from Z-Score in R

Calculate the p-Value from Z-Score in R, In statistics, we frequently want to know the p-value associated with a specific z-score obtained from a hypothesis test. We can reject the null hypothesis of our hypothesis test if this p-value is less than a certain level of significance. How to create contingency tables in R? –…

Read More “Calculate the p-Value from Z-Score in R” »

R

One sample proportion test in R-Complete Guide

Posted on May 25May 25 By Admin No Comments on One sample proportion test in R-Complete Guide
One sample proportion test in R-Complete Guide

One sample proportion test in R, when there are just two categories, the one proportion Z-test is used to compare an observed proportion to a theoretical one. This article explains the fundamentals of the one-proportion z-test and gives examples using R software. For example, we have a population that is half male and half female…

Read More “One sample proportion test in R-Complete Guide” »

R

How to add labels at the end of each line in ggplot2?

Posted on May 25May 25 By Admin No Comments on How to add labels at the end of each line in ggplot2?
How to add labels at the end of each line in ggplot2?

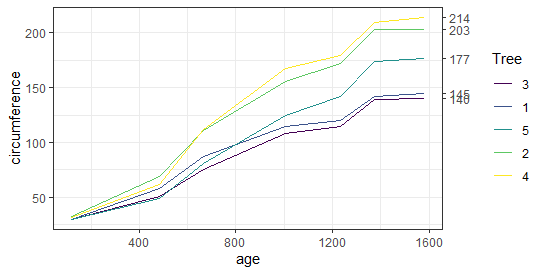
How to add labels at the end of each line in ggplot2?, Using the ggplot2 R library, this article shows how to display the last value of each line as a label. Using either the ggrepel text labeling or the ggplot2 secondary axis functions, many methods are shown. Test for Normal Distribution in R-Quick Guide…

Read More “How to add labels at the end of each line in ggplot2?” »

R

Error in sum(List) : invalid ‘type’ (list) of argument

Posted on May 21May 21 By Admin No Comments on Error in sum(List) : invalid ‘type’ (list) of argument
Error in sum(List) : invalid ‘type’ (list) of argument

Error in sum(List) : invalid ‘type’ (list) of argument, You’ll learn how to fix the “Error in FUN: invalid ‘type’ (list) of argument” in this R lesson. Example Data Creation The following list will serve as the foundation for this R tutorial. Checking Missing Values in R – Data Science Tutorials List <- list(1:10,    15,…

Read More “Error in sum(List) : invalid ‘type’ (list) of argument” »

R

Sorting in r: sort, order & rank R Functions

Posted on May 20May 20 By Admin No Comments on Sorting in r: sort, order & rank R Functions
Sorting in r: sort, order & rank R Functions

Sorting in r, The methods sort(), order(), and rank() in R are used to sort data in this article (). Sorting in r The tutorial uses six examples to demonstrate how to use the various sorting functions in the R programming language. Example 1: sort vs. order vs. rank (Basic Application) Let’s start by making…

Read More “Sorting in r: sort, order & rank R Functions” »

R

Subsetting with multiple conditions in R

Posted on May 19May 19 By Admin No Comments on Subsetting with multiple conditions in R
Subsetting with multiple conditions in R

Subsetting with multiple conditions in R, The filter() method in the dplyr package can be used to filter with many conditions in R. With an example, let’s look at how to apply a filter with several conditions in R. Let’s start by making the data frame. df<-data.frame(Code = c(‘A’,’B’, ‘C’,’D’,’E’,’F’,’G’),                  Score1=c(44,46,62,69,85,77,68),                 score2=c(35,78,45,89,67,49,70),                 …

Read More “Subsetting with multiple conditions in R” »

R

How to draw heatmap in r: Quick and Easy way

Posted on May 16May 16 By Admin No Comments on How to draw heatmap in r: Quick and Easy way
How to draw heatmap in r: Quick and Easy way

How to draw heatmap in r?, A heatmap is essentially a table with colors replacing the numbers. The colors represent the measuring level. It can help you locate highs and lows, as well as patterns. In this article, We’ll show you how to create a clustered heatmap with the R programming language’s pheatmap package. Let’s…

Read More “How to draw heatmap in r: Quick and Easy way” »

R

Posts navigation

Previous 1 … 18 19 20 … 22 Next
  • Descriptive Statistics in R
  • Multiple Plots to PDF in R
  • Run a specific code block in R
  • Replace first match in R
  • Display the structure in R
  • About Us
  • Contact
  • Disclaimer
  • Privacy Policy

https://www.r-bloggers.com

  • YouTube
  • Twitter
  • Facebook
  • Course
  • Excel
  • Machine Learning
  • Opensesame
  • R
  • Statistics

Check your inbox or spam folder to confirm your subscription.

  • How to Use the Multinomial Distribution in R
    How to Use the Multinomial Distribution in R? R
  • How to Compare Two Excel Sheets for Differences
    How to Compare Two Excel Sheets for Differences Excel
  • How to Join Data Frames for different column names in R
    How to Join Data Frames for different column names in R R
  • How to deal with text in R
    How to deal with text in R R
  • Algorithm Classifications in Machine Learning
    Algorithm Classifications in Machine Learning Machine Learning
  • Dynamic data visualizations in R
    Dynamic data visualizations in R R
  • Top 10 Data Visualisation Tools
    Top 10 Data Visualisation Tools Every Data Science Enthusiast Must Know Course
  • Duplicate and concatenate in R R

Privacy Policy

Copyright © 2024 Data Science Tutorials.

Powered by PressBook News WordPress theme