Skip to content

Data Science Tutorials

For Data Science Learners

  • Home
  • R
  • Statistics
  • Course
  • Machine Learning
  • Contact
  • About Us
  • Toggle search form
  • Methods for Integrating R and Hadoop
    Methods for Integrating R and Hadoop complete Guide R
  • Error in solve.default(mat)  Lapack routine dgesv system is exactly singular
    Error in solve.default(mat) :  Lapack routine dgesv: system is exactly singular: U[2,2] = 0 R
  • learn Hadoop for Data Science
    Learn Hadoop for Data Science Machine Learning
  • How do augmented analytics work
    How do augmented analytics work? R
  • The Multinomial Distribution in R
    The Multinomial Distribution in R R
  • Checking Missing Values in R
    Checking Missing Values in R R
  • How to compare the performance of different algorithms in R
    How to compare the performance of different algorithms in R? R
  • Data Science Strategies for Improving Customer Experience in R
    Data Science Strategies for Improving Customer Experience in R R

One sample proportion test in R-Complete Guide

Posted on May 25May 25 By Admin No Comments on One sample proportion test in R-Complete Guide
One sample proportion test in R-Complete Guide
Tweet
Share
Share
Pin

One sample proportion test in R, when there are just two categories, the one proportion Z-test is used to compare an observed proportion to a theoretical one. This article explains the fundamentals of the one-proportion z-test and gives examples using R software. For example, we have a population that is half male and half female…

Read More “One sample proportion test in R-Complete Guide” »

R

How to add labels at the end of each line in ggplot2?

Posted on May 25May 25 By Admin No Comments on How to add labels at the end of each line in ggplot2?
How to add labels at the end of each line in ggplot2?
Tweet
Share
Share
Pin

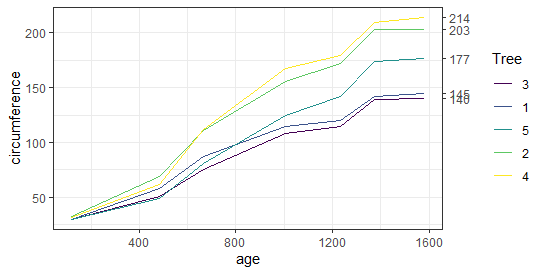
How to add labels at the end of each line in ggplot2?, Using the ggplot2 R library, this article shows how to display the last value of each line as a label. Using either the ggrepel text labeling or the ggplot2 secondary axis functions, many methods are shown. Test for Normal Distribution in R-Quick Guide…

Read More “How to add labels at the end of each line in ggplot2?” »

R

Artificial Intelligence Examples-Quick View

Posted on May 24May 24 By Admin No Comments on Artificial Intelligence Examples-Quick View
Artificial Intelligence Examples-Quick View
Tweet
Share
Share
Pin

Are you curious about Artificial Intelligence Examples? If you answered yes, then this article is for you.  We’ll go over some Artificial Intelligence instances here. So, spend a few minutes reading this article to learn everything there is to know about Artificial Intelligence Examples. What are some examples of artificial intelligence? Before going on to…

Read More “Artificial Intelligence Examples-Quick View” »

Course

Error in sum(List) : invalid ‘type’ (list) of argument

Posted on May 21May 21 By Admin No Comments on Error in sum(List) : invalid ‘type’ (list) of argument
Error in sum(List) : invalid ‘type’ (list) of argument
Tweet
Share
Share
Pin

Error in sum(List) : invalid ‘type’ (list) of argument, You’ll learn how to fix the “Error in FUN: invalid ‘type’ (list) of argument” in this R lesson. Example Data Creation The following list will serve as the foundation for this R tutorial. Checking Missing Values in R – Data Science Tutorials List <- list(1:10,    15,…

Read More “Error in sum(List) : invalid ‘type’ (list) of argument” »

R

Sorting in r: sort, order & rank R Functions

Posted on May 20May 20 By Admin No Comments on Sorting in r: sort, order & rank R Functions
Sorting in r: sort, order & rank R Functions
Tweet
Share
Share
Pin

Sorting in r, The methods sort(), order(), and rank() in R are used to sort data in this article (). Sorting in r The tutorial uses six examples to demonstrate how to use the various sorting functions in the R programming language. Example 1: sort vs. order vs. rank (Basic Application) Let’s start by making…

Read More “Sorting in r: sort, order & rank R Functions” »

R

Subsetting with multiple conditions in R

Posted on May 19May 19 By Admin No Comments on Subsetting with multiple conditions in R
Subsetting with multiple conditions in R
Tweet
Share
Share
Pin

Subsetting with multiple conditions in R, The filter() method in the dplyr package can be used to filter with many conditions in R. With an example, let’s look at how to apply a filter with several conditions in R. Let’s start by making the data frame. df<-data.frame(Code = c(‘A’,’B’, ‘C’,’D’,’E’,’F’,’G’),                  Score1=c(44,46,62,69,85,77,68),                 score2=c(35,78,45,89,67,49,70),                 …

Read More “Subsetting with multiple conditions in R” »

R

How to draw heatmap in r: Quick and Easy way

Posted on May 16May 16 By Admin No Comments on How to draw heatmap in r: Quick and Easy way
How to draw heatmap in r: Quick and Easy way
Tweet
Share
Share
Pin

How to draw heatmap in r?, A heatmap is essentially a table with colors replacing the numbers. The colors represent the measuring level. It can help you locate highs and lows, as well as patterns. In this article, We’ll show you how to create a clustered heatmap with the R programming language’s pheatmap package. Let’s…

Read More “How to draw heatmap in r: Quick and Easy way” »

R

Change ggplot2 Theme Color in R ggthemr Package

Posted on May 15May 15 By Admin No Comments on Change ggplot2 Theme Color in R ggthemr Package
Change ggplot2 Theme Color in R ggthemr Package
Tweet
Share
Share
Pin

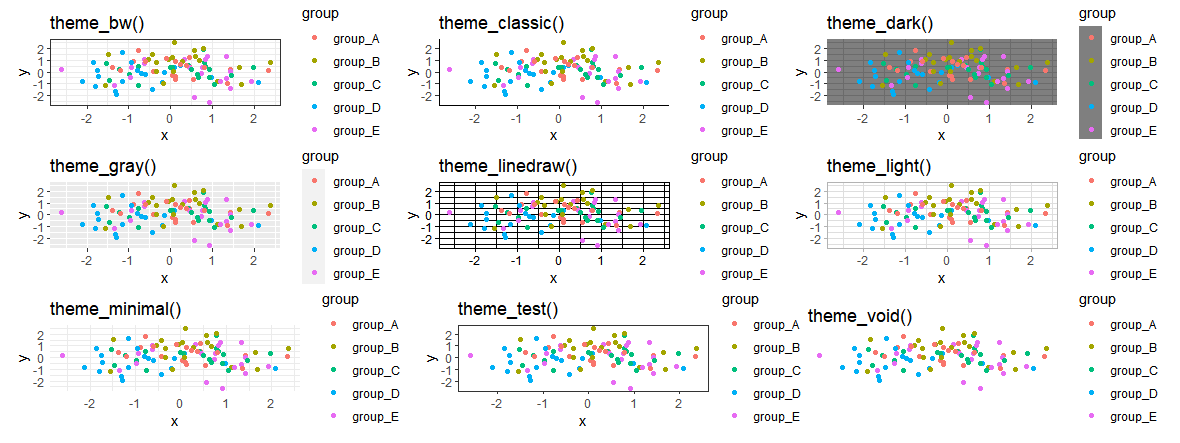
 In this article, you’ll learn how to change the colors of ggplot2 visuals in the R programming language by utilizing different themes. Let’s start by making some sample data in R. set.seed(123)                             df <- data.frame(x = rnorm(100),                    y = rnorm(100),                    group = paste0(“group_”, LETTERS[1:5])) head(df)                                       x          y   group 1  0.7842588 -0.3663221 group_A 2 …

Read More “Change ggplot2 Theme Color in R ggthemr Package” »

R

Best Books to Learn R Programming

Posted on May 15August 22 By Admin No Comments on Best Books to Learn R Programming
Best Books to Learn R Programming
Tweet
Share
Share
Pin

Best Books to Learn R Programming, R and Python are now the most popular programming languages for performing data science, and each has its own set of advantages and downsides. Python is preferred for Machine Learning because of its production-ready architecture and the ease with which data analysis can be integrated with websites. By virtue…

Read More “Best Books to Learn R Programming” »

Course

How to make a rounded corner bar plot in R?

Posted on May 14May 14 By Admin No Comments on How to make a rounded corner bar plot in R?
How to make a rounded corner bar plot in R?
Tweet
Share
Share
Pin

Rounded corner bar plot in R, we’ll show you how to use the ggchicklet package in the R programming language to make a ggplot2 bar chart with rounded bars. The ggchicklet Package: An Overview Bob Rudis’ ggchicklet package includes utilities for creating rounded rectangle segmented column charts (often known as “chicklets”). Let’s dive into the…

Read More “How to make a rounded corner bar plot in R?” »

R

Posts navigation

Previous 1 … 22 23 24 … 26 Next
  • Duplicate and concatenate in R
  • Locate position of patterns in a character string in R
  • Sort or Order Rank in R
  • Divide data into groups in R
  • Extract certain rows of data set in R
  • About Us
  • Contact
  • Disclaimer
  • Privacy Policy

https://www.r-bloggers.com

  • YouTube
  • Twitter
  • Facebook
  • Course
  • Excel
  • Machine Learning
  • Opensesame
  • R
  • Statistics

Check your inbox or spam folder to confirm your subscription.

  • How to handle Imbalanced Data
    How to handle Imbalanced Data? R
  • best books about data analytics
    Best Books to learn Tensorflow Course
  • Best Books to Learn R Programming
    Best Books to Learn R Programming Course
  • gganatogram Plot in R
    How to create Anatogram plot in R R
  • Error in sum(List) : invalid 'type' (list) of argument
    Error in sum(List) : invalid ‘type’ (list) of argument R
  • How to Display Percentages on Histogram IN R
    How to Display Percentages on Histogram in R R
  • Cumulative Sum calculation in R
    Cumulative Sum calculation in R R
  • Number to Percentage in R
    Number to Percentage in R R

Privacy Policy

Copyright © 2024 Data Science Tutorials.

Powered by PressBook News WordPress theme